Operations | Monitoring | ITSM | DevOps | Cloud
Latest Videos
Observable Web Applications
Users don’t see your distributed services, cloud architecture, or instrumentation—they only see how the web app is working. Understanding their experience in the client-side is the first step towards understanding the rest of the system. We’ll explore how to make your client-side applications more observable through error tracking, web performance, and usage analytics. With better understanding of real-user experience, you’ll better understand the real behavior of your systems.
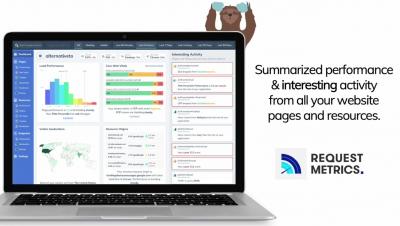
Request Metrics Released! What We Changed.
We released Request Metrics and it's going well--but we didn't get everything right the first time. In Part 3 of our "Request Metrics Released" series, we look at what we changed along the way and where we are focused next. Learn more about Request Metrics at requestmetrics.com
Request Metrics Released! What We Got Wrong.
Request Metrics has released and going well. We made some good choices and some not so good choices. Watch Part 2 of our Request Metrics Released series to see how things are going, and what we got wrong!
The Biggest ASP.NET Core Performance Problem
Microsoft is playing fast and loose with performance and localization. Things are getting worse for Windows in.Net 5.0. Watch as Eric explains the performance issue and how to avoid it.
Request Metrics Released! What We Got Right.
It's been a long time since we produced a new Request Metrics video and we wanted to give an update! Things have been going well and the product is out there! We made some good choices. Some not so good choices. And we've made many enhancements since launch. Watch Part 1 of our Request Metrics Released series to see how things are going, and what we did right!
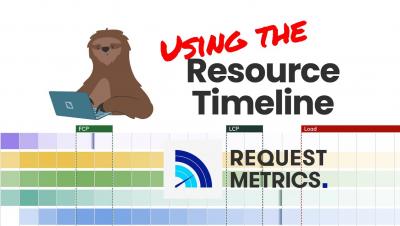
Using the Resource Timeline in Request Metrics
The Resource Timeline in Request Metrics is a heat map of all the files requested by your pages. It shows the range of resource load time and critical load events experienced by all users, not just a single point load. The data allows you to see which resources impact your page metrics as well as the variability in their load time.
Crazy Like a Fox: Redis as Your Primary Database
Redis is fast. It’s fast because the data is all in memory. Persistence options are limited. Because of this, many people say, “Redis is for transient data only!” However, sometimes the need for speed and ease of operations can outweigh the durability downsides! In this talk, we look at a real SaaS business using Redis as its (only) datastore. You’ll learn why we decided to go all-in on Redis and the challenges we faced. You’ll learn how we operationalized the setup, handle backups and restores, and how we’ll scale out. Are we making a terrible mistake? You be the judge!
Breaking Out of Webpack Based Build Chains
Javascript build chains have gotten outrageously complicated. Let's create one that isn't. Request Metrics monitors how real users experience the performance of your production websites. We need a JavaScript agent to pull performance data out of the browser. Watch as I calmly Bob Ross my way to a Webpack-free Typescript build pipeline with just a few NPM packages.
Using the Beacon API
Users are so annoying! There they go, leaving the page before we can save the data to the API. Back in the old days, we would attach a `window.unload` handler and try to send an AJAX request, but this was slow and unreliable. Enter the Beacon API to give us a better way. The Beacon provides a reliable way to send a small amount of data *after* the page has been unloaded. It's not bound to the lifetime of the page and it doesn't slow down the user.


