We had a blast at AWS re:Invent 2024 and our team was invigorated by the incredible response and feedback we received from the thousands of participants who visited our booth. It was clear that a recurring theme among companies is the need for an observability solution that not only scales affordably with increasing data volumes but is also at the forefront of innovation. Coralogix stands out as the ideal match for these requirements.
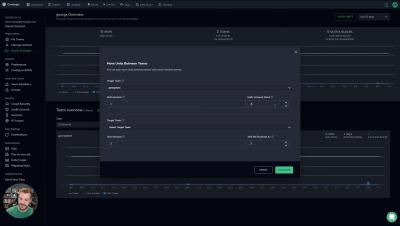
Coralogix supports multi-tenancy, allowing multiple teams to be connected under a single organization. Some companies prefer separate teams to isolate data based on the environment it originates from like: Dev, QA, or Production. While others prefer to isolate the data based on organizational units like: Infrastructure, Security, and Application. Coralogix allows you to associate multiple teams with an Organization.
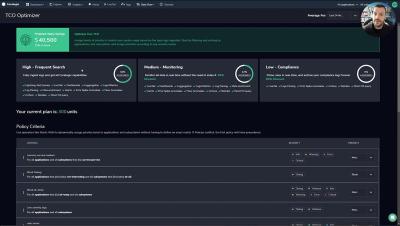
Coralogix TCO Optimizer allows you to assign different logging pipelines for each application and subsystem pair and log severity. In this way, it allows you to define the data pipeline for your logs based on the importance of that data to your business.
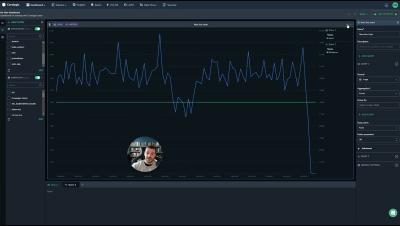
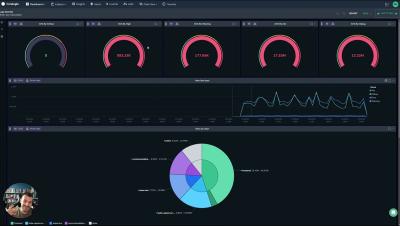
Let's explore the rich and powerful world of Custom Dashboards in Coralogix, with explanations of every widget, powerful functionality, flexible variables and much more. This video will leave no stone unturned!
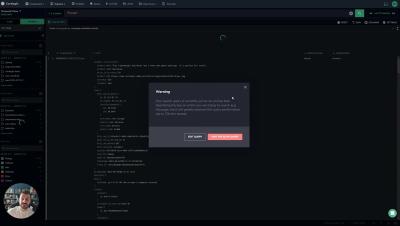
Explore the Archive Query mode in Coralogix Custom Dashboards, to visualize data that has long since left your archive, without paying for enormous indexing costs. Hold the data in your cloud account, and query, transform and enhance, with a single button press.
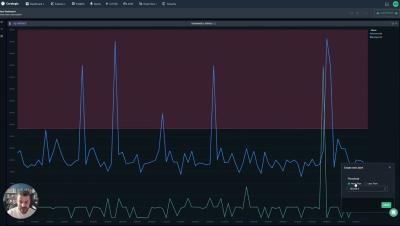
Defining Alerts and Metrics in Coralogix is the easiest thing in the world. In this video, we'll explore three different alerts and metrics that can be generated, without writing a line of code.
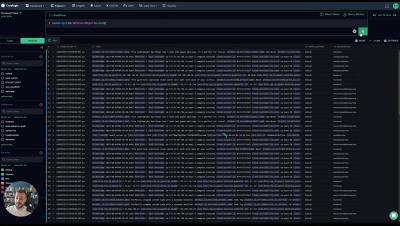
DataPrime is much more than a simply querying language. It's a data discovery language, allowing for powerful aggregations and insight generation, right in the Coralogix UI.