Operations | Monitoring | ITSM | DevOps | Cloud

December 2019

Speed up your root cause analysis with Metric Correlations

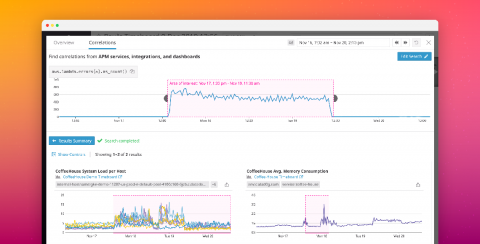
In a world where the applications we run are constantly changing, the number of monitored metrics and events is skyrocketing, and responsibility for system components is fragmented across teams, it becomes increasingly difficult to pinpoint possible root causes of an issue in a timely manner. To address this challenge, we’re introducing Metric Correlations, which automatically finds candidates for the causes of an issue by searching your system for correlated metrics.

SAP HANA monitoring with Datadog

SAP HANA is a data analytics platform that uses an in-memory, column-oriented data store to efficiently execute transactional (OLTP) and analytical (OLAP) queries. It can perform these queries against its own tables, or against data that resides in remote, non-SAP databases like Hadoop or SQL Server. SAP HANA also serves as the database behind SAP’s S/4HANA ERP platform. Datadog’s new integration helps you better understand the health and performance of your SAP HANA systems.

Introducing Datadog Agent 7 with Python 3 support

We’re excited to release version 7 of the Datadog Agent. It has all of the same functionality as Agent 6, but it is the first version to ship with only the Python 3 runtime. With Python 2 reaching its end of life on January 1, 2020, migrating your services to Python 3 will ensure that they continue working as expected. We’ve tested all of our more than 350 integrations to ensure they work with Python 3.

Monitor Cilium with Datadog

Cilium is an open source technology that delivers network security to large-scale containerized environments at the packet and application levels. Cilium integrates easily with your Kubernetes clusters, either self-managed or managed services (e.g., Amazon EKS, Google GKE, and Microsoft AKS). You can also deploy Cilium to Docker environments using Mesos.

Monitor systemd with Datadog

Systemd is an initialization program that manages processes on Linux systems. It was designed to improve the performance of its predecessors by creating a dependency tree of system components, initializing them only when needed, and using as much parallelization as possible. With systemd becoming ubiquitous in Linux distributions, it’s crucial that you monitor the health and performance of both systemd and the components that it manages.

Monitor Azure DevOps workflows and pipelines with Datadog

Microsoft Azure DevOps is a leading platform for planning, building, and deploying code. We are excited to announce a new integration with Azure DevOps, which helps organizations see the full picture as they build and deploy dynamic applications. Teams can get new insights into their builds, releases, work items, and code events; understand how deployments impact application performance; and even halt bad updates automatically.

Best practices for tagging your infrastructure and applications

Most modern platforms like AWS and Kubernetes create dynamic environments by quickly spinning up instances or containers with significantly shorter lifespans than physical hosts. In these environments, where large-scale applications can be distributed across multiple ephemeral containers or instances, tagging is essential to monitoring services and underlying infrastructure.

How to monitor Lambda functions

As serverless application architectures have gained popularity, AWS Lambda has become the best-known service for running code on demand without having to manage the underlying compute instances. From an ops perspective, running code in Lambda is fundamentally different than running a traditional application. Most significantly from an observability standpoint, you cannot inspect system-level metrics from your application servers.

Monitor AWS IAM Access Analyzer findings with Datadog

As you monitor the health and performance of your infrastructure and applications, you also need to be able to identify potential threats to the security of those components. To help address this challenge, we’re pleased to announce that Datadog now integrates with AWS Identity and Access Management (IAM) Access Analyzer, a new IAM feature that helps administrators ensure that they have securely configured access to their resources.

Monitor Druid with Datadog

Apache Druid is a data warehouse and analytics platform that can capture streaming data from message queues like Apache Kafka and batch data from static files. Druid can be a valuable component in your technology stack if you need to collect real-time data for online analytical processing (OLAP) tasks like reporting, ad-hoc querying, and dashboarding.

Introducing Datadog Real User Monitoring

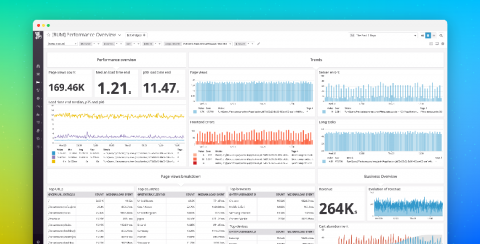
The performance of your website is a key element in the success of your business—slow page load times and errors can degrade the user experience, leading to customer churn, fewer ad impressions, or abandoned shopping carts. To give you end-to-end visibility into the real-time activity and experience of individual users, we’re excited to add Real User Monitoring (RUM) to Datadog.

Monitor your Arm VMs with Datadog

Acorn RISC Machine (Arm) processors were first released in 1985 to support low-power, low-cost computing. Because of their ability to deliver cost-effective performance, the next big use for Arm-based devices is in the cloud. AWS recently added a range of Arm-based EC2 instance types and is developing additional support (e.g., in Elastic Kubernetes Service). Meanwhile, Arm and Docker are working on tighter integration.

Monitor Amazon EKS on AWS Fargate with Datadog

AWS Fargate has steadily gained traction in Amazon Elastic Container Service (ECS) environments because it allows users to run containerized applications without thinking about their underlying infrastructure. Today, AWS announced that support for Amazon Elastic Kubernetes Service (EKS) on AWS Fargate is now generally available, giving Amazon EKS users the option to seamlessly manage their infrastructure with AWS Fargate instead of manually provisioning EC2 worker nodes.

Monitor AWS Lambda Provisioned Concurrency metrics with Datadog

Serverless computing continues to be a growing trend, with AWS Lambda as a main driver of adoption. Today, AWS released Provisioned Concurrency, a new feature that makes AWS Lambda more resilient to cold starts during bursts of network traffic. If you’re running a consumer-facing application, slow page loads and request timeouts can degrade the user experience and lead to significant revenue loss.

Monitoring AWS Lambda functions with Datadog

The “serverless” movement is taking the industry by storm and now, with Datadog, you can start monitoring your serverless applications and functions on AWS Lambda. As soon as you enable the Lambda integration, you’ll start to see your metrics in an out-of-the-box dashboard like the one above. Monitor and alert on AWS Lambda serverless functions in minutes with Datadog.

Monitor G Suite activity with Datadog

G Suite is a collection of cloud-based productivity and collaboration tools developed by Google. Today, millions of teams use G Suite (e.g., Gmail, Drive, Hangouts) to streamline their workflows. Monitoring G Suite activity is an essential part of security monitoring and audits, especially if these applications have become tightly integrated with your organization’s data.