

Operations | Monitoring | ITSM | DevOps | Cloud

Measuring soft navigation web vitals

If we were to reduce web performance into a single term, it would be “web vitals”. Web vitals are a universal signal that every developer can measure, and more importantly, optimize for. They describe many facets of the user experience when it comes to performance, but they were limited to specific types of navigations. Capturing web vitals for your apps has been largely about users landing on your site from somewhere else. We measured that experience and you optimized for it.

Sentry under 8 mins

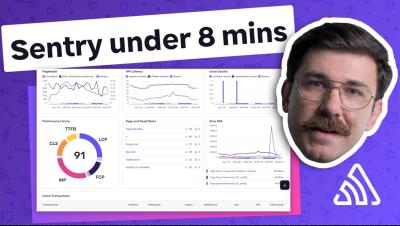
If you've never used Sentry, this is the short version. In under eight minutes, we walk through what it does, what it captures, and where to go next. Sentry is an application monitoring platform. It collects errors, logs, timings, and replays, and ties them together with tracing, so you can go from "something broke" to the line of code that broke it without opening six tabs. Here's what we cover: On data: out of the box, Sentry scrubs things like passwords, tokens, and credit card numbers. You decide what else gets collected, and you can choose US or EU storage.

Five things you can do with Sentry's Agent Tracing

AI-powered apps are hard to debug without observability. From one run to another, AI produces different results, goes down different paths, and you’re none the wiser as to why it’s happening. Agent Tracing bridges the gap between prompt, tool calls and final output, all within the context of your app. If things break (it always does at some point, we know from experience), you get everything in one complete trace.

Application Metric or Log? Which should you use?

Sentry offers both "Application Metrics" and "Logs", but both can seem pretty similar. Both logs and metrics are just a collection of attributes attached to a name in your code. Both can be counted, visualized, or alerted on. Both are not sampled by default. So how do you know which to choose? In this video, we'll briefly go over a few examples of when to use logs and when to use metrics. TLDR; Logs are designed for debugging and may be temporary or likely to change when problems arise. Metrics on the other hand are stable, purposely placed events used to track user behaviors.

How a beagle-shaped AI agent ships code to madewithvuejs.com

This is a guest post from Armin Ulrich, a fullstack developer, and founder of placid.app. He also created the MadeWith* network where he shares his projects and allows other developers to share theirs. Two people and one beagle run the project showcase madewithvuejs.com. The beagle is actually an AI agent that we have added to our workflows, but we’re very fond of her by now. Milly is part of the team, scouting for content, building features and sniffing for bugs.

Powering Warp Factories with Sentry

Recently Warp introduced some new cloud software factories for setting up bespoke workflows and agents within your organization. The best part is that you can integrate Sentry directly into these factories. Whether you want to create an automated debugging workflow leveraging Sentry context or capture agent metrics for evals and performance data, Warp and Sentry have got it covered.

Should you use a log or a metric?

Since Sentry added Logs and Application Metrics, there are now two ways to record that something happened in your app, and they can look pretty similar: Sentry.logger.info("user.signup") versus Sentry.metrics.count("user.signup"). Both store attributes, both include shared context automatically, and both can be filtered, grouped, and counted. So when you’re instrumenting your code, which one do you reach for?

We just gave a million dollars to Open Source maintainers

The title is not a joke. For those of you who know Sentry, you know we’ve been giving back to Open Source maintainers since our early days in whatever ways we could. But around five years ago we really started to give in a more meaningful way. This year we increased our budget from $750,000 to $1,000,000.

Sentry's Flutter SDK 10.0: Streaming Traces and More Accurate Crash-Free Rates

Sentry’s Flutter SDK 10.0 makes streaming traces the default and changes how unhandled Flutter errors affect Release Health. Errors that leave your app running no longer mark the session as crashed, so your crash-free rate better reflects actual app crashes. The release also gives app startup its own trace on Android and iOS, simplifies logs and metrics setup, expands Dio network error capture, and respects Flutter’s sensitive-content markings in Replay and screenshots.

Fixing 3 issues with one distributed trace

Use Sentry tracing to investigate three different problems in one shopping flow: an N+1 query, an expired promo-code warning, and a checkout exception. The entire shopping flow happens through the agent conversation on Empower Plant’s homepage: a search for plants under $200, adding one of each to the cart, starting checkout, applying SAVE20, then attempting to place the order. The trace connects that flow to repeated database queries and an N+1 issue, a warning that SAVE20 has expired, and a checkout exception with its inventory-validation stack trace.

Sentry JavaScript SDK v11 adds tracing for all JS platforms

This post is about a recent change to the Sentry JavaScript SDKs. If you don’t use Sentry with JavaScript, it may still be useful as a look at how we made the change and why. In the Sentry JavaScript SDK v11, we rebuilt how our tracing integrations work. While we still support the OpenTelemetry standard (described in more detail below), we now instrument your dependencies with a code transformer instead of using the OpenTelemetry instrumentation classes as we did in previous versions.

Reducing Android scope-sync overhead in Sentry Flutter

Our SDK adds work to the app that installs it. It records recent app activity as breadcrumbs and keeps user information and other diagnostic data up to date. Changes to that information are called scope updates. On Android, we send those updates to a worker isolate, which passes them to the Sentry Android SDK. We found that the calling isolate and the worker both normalized the same data. The encoding step also created a JSON string and an extra byte buffer that we could avoid.

Searching Sentry Logs with Regex

We use Sentry's new Regex search for Logs to hunt for non-obvious bugs in our app. What do you do when traces show that Postgres jobs are backing up? Logs are trace-connected, so by looking at one of the affected traces, we can see all of the logs on that trace. In there, we can see Postgres has logged that it acquired a lock only after a long wait. Using regex, we can find all of these logs that describe acquiring a lock after a 10-second-plus wait. That narrows our search from thousands or hundreds of logs down to about a dozen.

Seer Agent: Get Answers. Take Action.

This video walks through what it looks like to treat Sentry's Seer agent the way you already treat a chatbot, asking it plain language questions about your own production application. From Slack or inside your Sentry account, Seer Agent can answer questions with real context: the affected spans, the recent release, the likely cause. Seer doesn't stop at answering questions. Ask it to act on what it just told you and it completes that work inside Sentry, serving as an assistant to your projects, team workflows, and your future self.

Unreal MCP now speaks Sentry

Setting up crash reporting is rarely the most exciting part of shipping a game. Paste a DSN, flip a few checkboxes in Project Settings, turn on symbol upload, package a build, crash it on purpose and check that the event shows up in Sentry… It’s not hard to do (and important), but it’s the kind of work you’d happily hand off to someone else. With Unreal Engine 5.8, that someone else can be your coding agent.

Seer, the Sentry MCP and CLI, or your own coding agent: where each one fits

I’ve been getting some version of this question a lot lately, mostly in our Seer preview webinars. Different audiences, same handful of questions: Worth answering all three in one place. Honestly, I needed to write this down for myself too. Things are moving fast around all of us and answers seem to get more nuanced by the week. This is an attempt to codify the difference: what each option is and when it makes sense to reach for one over the other.