Anomaly rate in every chart
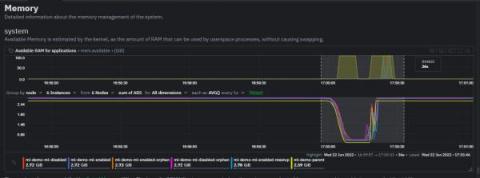
A month ago, we introduced unsupervised ML & Anomaly Detection in Netdata, the Anomaly Advisor. Today, we’re happy to announce that we’re bringing anomaly rates to every chart in Netdata Cloud. Anomaly information is no longer limited to the Anomalies tab and will be accessible to you from the Overview and Single Node View tabs as well. This will make your troubleshooting journey easier, as you will have the anomaly rates for any metric available with a single click.


