Operations | Monitoring | ITSM | DevOps | Cloud

Native macOS Monitoring: Logs, Sensors, GPU & Hardware Health

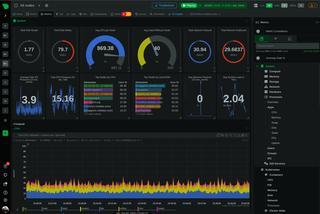
We’ve overhauled macOS monitoring in the latest Netdata release. Netdata already collects system metrics on Macs at per-second resolution; this release completes the picture with logs and hardware telemetry, areas that previously required users to run CLI tools like log show and powermetrics. The new collectors read this data through Apple’s own frameworks, allowing users to trace application and OS errors and catch hardware issues early.

Real Time Network Monitoring: Topology, NetFlow, SNMP

Interface counters tell you a port is busy. Bytes in, bytes out, errors, drops. That’s enough to know a link is saturated, but not enough to know which conversations are saturating it, which devices are involved, or how a problem propagates across your network. For that you’ve traditionally needed dedicated network performance monitoring tools, usually expensive, usually a separate console from the rest of your monitoring.

Network Device Monitoring: Topology Maps and NetFlow

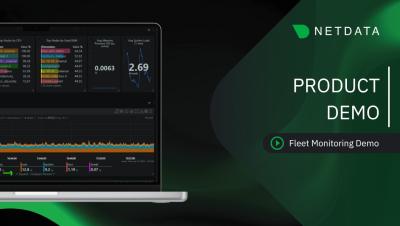
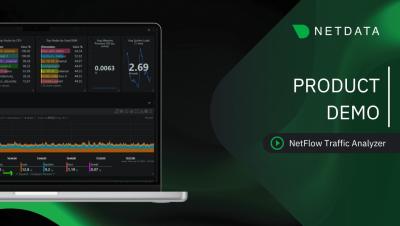
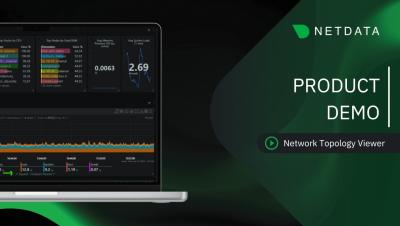
Most teams run one tool for SNMP polling, another for topology, and a third for flow analysis, then spend their time stitching the views together. This webinar shows how Netdata brings all three into a single dashboard, with 100+ vendor profiles out of the box, automatic Layer 2 topology mapping, and a flow collector that auto-detects NetFlow, IPFIX, and sFlow on a single port.

High Cardinality Metrics At Scale: A Better Playbook

The “high cardinality is expensive” sentence has become observability’s version of “in this economy” — said so often that nobody questions whether it’s true. Every vendor pricing page invokes it. Every glossary article repeats it. Every architecture diagram shows aggregation buffers placed before the storage layer.

OpenTelemetry Monitoring with Netdata

If you've standardized on OpenTelemetry (or you're heading that way), you probably know the collector gets your data out, but where it lands and how useful it is once it gets there are separate problems. Netdata now ingests both OTLP metrics and OTLP logs natively, so your OTel pipelines feed directly into the same monitoring experience as everything else in your infrastructure: same dashboards, same alerting, same query interface. No separate backends, no context switching.

Netdata Skills: Teach Your AI Coding Agent To Monitor

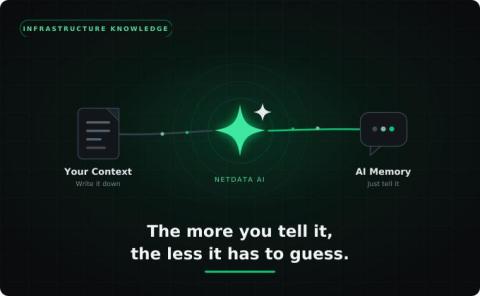
There’s a growing ecosystem of AI coding agents: Claude Code, Cursor, Copilot, Codex, Gemini CLI, Windsurf, and others. They’re good at writing code, but they don’t inherently know how to instrument that code for observability, configure monitoring infrastructure, or troubleshoot production systems using real telemetry data. That knowledge lives in documentation, runbooks, and the heads of your senior SREs.