Operations | Monitoring | ITSM | DevOps | Cloud

December 2022

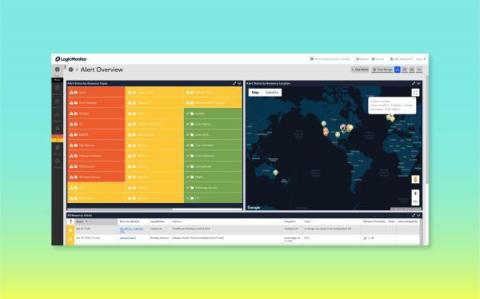
Ingesting and analyzing 2022: an LM Logs success story

A new year means a new set of goals. In 2022, we set some lofty goals to help our customers achieve clarity across their modern IT infrastructure. We set out to do this by improving our log collection and analysis within LM Envision, our unified observability platform, which was announced at LogicMonitor’s Elevate user conference this summer. At the conference, we gathered feedback to understand the various ways our customers access and review log data.

Incident management vs. event management

As you explore IT event management and IT incident management, they may look and even sound similar, but it’s essential to understand how they differ. Your IT management team needs to know what to look for, both in an event and an incident, so they can resolve any red-flag issues and return your system to normalcy. But why is it so important to recognize the difference?

How we scaled a stateful microservice using Redis

At LogicMonitor, ingesting and processing time series metric data is arguably the most critical portion of our unified observability platform. In order to fully prepare for growth, scale, and fault-tolerance, we have evolved what we refer to as our Metrics Processing Pipeline from a monolith to a microservice-driven architecture.

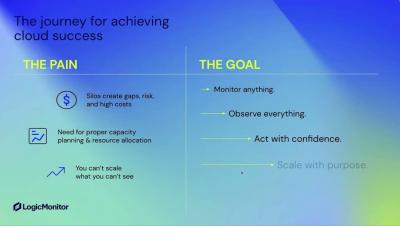
Cloud & observability: hot topics from AWS re:Invent

A couple of weeks ago, I had the opportunity to attend AWS re:invent, one of the biggest cloud industry events of the year. An event so massive and big that only AWS can pull it off – 50,000 people marching across half a dozen of the finest hotels on the Las Vegas strip. The expo hall alone would have taken more than a couple of days to cover all the vendor booths spread across the expansive Venetian convention center.

LM Envision Application Topology: A New Way To Visualize Application Connections

Finding service relationships and diagnosing bottlenecks within an application can be incredibly difficult to accomplish, especially if your applications are spread across multiple services, with both internal and external service calls. Although users could get granular visibility into individual traces using our Distributed Tracing features, they couldn’t see how their services were connected across different traces.

What is FluentD, and how does it work with Kubernetes?

FluentD is a free and open-source data collector. With its decentralized ecosystem, it’s known for its built-in reliability and cross-platform compatibility. One of the biggest challenges in big data collection is the lack of standardization between collection sources. They just aren’t able to talk to each other. With FluentD, you can address one of the biggest challenges to big data log collection.

Monitoring AWS Analytics and Services for Business Continuity

Amazon Web Services (AWS) products can feel countless, and at LogicMonitor, we are working tirelessly to bring monitoring support to as many of them as possible. With so many products and tools already on your plate, we want to make sure that monitoring is not a hassle, but rather a trusted companion. AWS provides tools that help with application management, machine learning, end-user computing, and much more.