Operations | Monitoring | ITSM | DevOps | Cloud

September 2024

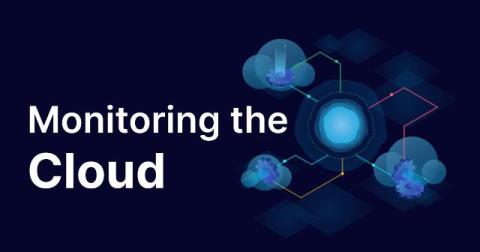
What a Cloud Monitoring Architecture looks like

In today’s fast-paced, digitally-driven business world, cloud computing has become the foundation of scalable and flexible IT infrastructure. As organizations transition to the cloud to gain agility, scalability, and cost savings, it becomes crucial to monitor cloud environments rigorously. This ensures performance, security, and reliability. That’s why having a good cloud monitoring system, like Icinga, is critical for cloud operations.

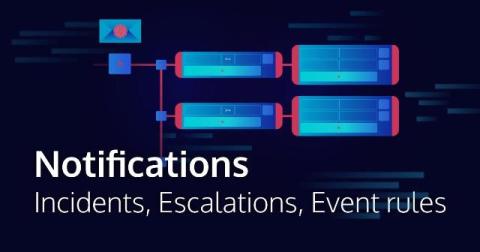
Icinga Notifications: Incidents, Escalations, and Event Rules

Following the Icinga Notifications beta announcement, we already had a more general post on how to get started and one going into the details of schedules. This week’s blog post is a follow up in this series and will describe incidents, escalations, and event rules in Icinga Notifications in more detail. In case you haven’t seen the first two referenced blog posts, you might want to have a look at them first, otherwise, you could miss out on the big picture.

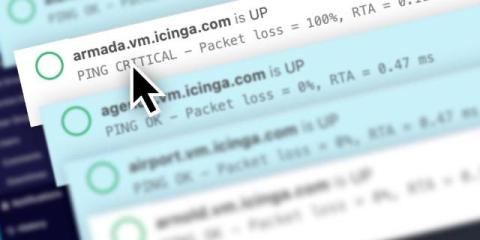
Multi Element Selection in Icinga DB Web

From time to time we want to bring not so widely known features of Icinga into spotlight. In this effort it’s a not so obvious feature, that was available in the monitoring module of Icinga Web 2 at some point already. It has also been available in Icinga DB Web since its release. We’re talking about selecting multiple list items. Our goal was to make it as obvious as possible, without wasting screen space for those users who are already aware of the feature.