Operations | Monitoring | ITSM | DevOps | Cloud

September 2024

Syncing PagerDuty Schedules to Slack Groups

We’ve posted before about how engineers on call at Honeycomb aren’t expected to do project work, and that whenever they’re not dealing with interruptions, they’re free to work on whatever will make the on-call experience better. However, all of our engineering rotations rely on hand-off meetings where they update the Slack groups with everyone who’s on call. During my last shift, a small problem kept causing friction for some of our incident management automation.

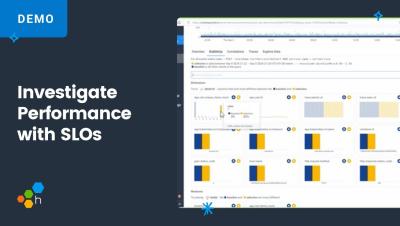
Investigate Performance issues with SLOs

When an alert goes off because a Service Level Objective (SLO) is in danger of violation, it comes with a lot of context about what has been going wrong and for how long. Then Honeycomb gives you tools to explore the where & why. Here, Martin Thwaites walks through an example of diagnosing slower performance. What service is the problem, and under what circumstances?

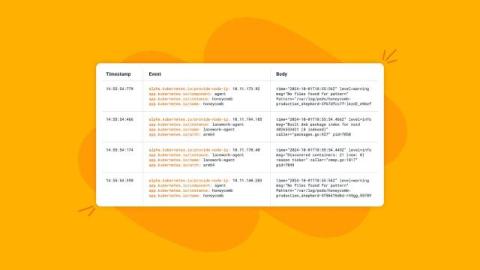
The OTTL Cookbook: Common Solutions to Data Transformation Problems

As our software complexity increases, so does our telemetry—and as our telemetry increases, it needs more and more tweaking en route to its final destination. You’ve likely needed to change an attribute, parse a log body, or touch up a metric before it landed in your backend of choice. At Honeycomb, we think the OpenTelemetry Collector is the perfect tool to handle data transformation in flight. The Collector can receive data, process it, and then export it wherever it needs to go.

Beyond Backend: Honeycomb for Frontend Observability is Now GA

Real user monitoring (RUM) tools are great if you want to give your developers a very high level view of the health of your frontend. But when it comes to actually debugging issues in your web app, you’re often left piecing together outputs from browser devtools, with details (if you’re lucky) from customer support tickets to replicate issues locally in hopes of identifying the source of the issue. Debugging Core Web Vitals (CWVs) to improve your scores can be even worse.

Debugging INP With Honeycomb for Frontend Observability

Interaction to Next Paint is the newest of Google’s Core Web Vitals. The three metrics that make up the CWVs are Google’s attempt at defining proxy metrics for measuring things they believe are critical to a good user experience on the web. The three metrics are: Debugging and fixing these metrics can be quite complicated. In this post, I’m going to walk through how you can use Honeycomb for Frontend Observability to debug INP, which was just promoted to a stable Core Web Vital in March.

An Engineer's Checklist of Logging Best Practices

The best DevOps and SRE teams have shifted their approach to monitoring and logging their systems. These teams debug problems cohesively and rationally, regardless of the system’s complexity. Gone are the days of having a slew of logs that fail to explain the cause of alerts, system failures, and other unknowns.

A CoPE's Duty: Indexing on Prod

Odds are that a software engineer today is really focused on one place: pre-prod. Short for “pre-production,” this is slang for an environment where software code operates in a prototype phase of its development lifecycle. Common sense would have one believe that this is a safe space, a workbench of sorts, where problems can be found and remediated.

An Ode to Events

At this point, it’s almost passé to write a blog post comparing events to the three pillars. Nobody really wants to give up their position. Regardless, I’m going to talk about how great events are and use some analogies to try to get that across. Maybe these will help folks learn to really appreciate them and to depreciate a certain understanding of the three pillars. Or maybe not.

Is OpenTelemetry Open for Business? September 2024 Update

One of the things about OpenTelemetry that’s easy to miss if you’re not spending the whole day in the ins and outs of the project is just how much stuff it can do—but that’s what I’m here for! Today, I want to go through the project and give you a guide to the various parts of OpenTelemetry, how mature they are, and what you can expect over the next six months or so. I ranked these elements by relative maturity across the entire project.

Is it Time to Version Observability? Signs Point to Yes

In 2016, we at Honeycomb first borrowed the term “observability” from the wikipedia entry for control systems observability, where it is a measure of your ability to understand internal system states just by observing its outputs. We then spent a couple of years trying to work out how that definition might apply to software systems. Many twitter threads, podcasts, blog posts, and lengthy laundry lists of technical criteria emerged from that work, including a whole ass book.

The Evolution of Engineering and the Role of Observability 2.0 in Shaping the Future

Engineering has come a long way since the days of delivering discrete, point-in-time products that were often packaged on a CD and shipped to customers. The days of physical media and long development cycles are long gone. The advent of cloud computing and the rise of Software-as-a-Service (SaaS) transformed the landscape, creating a new model of continuous development and service delivery. This shift has not only revolutionized how software is developed, but has also redefined the engineer’s role.

Getting Started With Refinery: Rules File Template

Sampling is a necessity for applications at scale. We at Honeycomb sample our data through the use of our Refinery tool, and we recommend that you do too. But how do you get started? Do you simply a set rate for all data and a handful of drop and keep rules, or is there more to it? What do these rules even mean, and how do you implement them? To answer these questions, let’s look at a rules file template that we use for customers when first trying out Refinery.