Operations | Monitoring | ITSM | DevOps | Cloud

Latest Posts

Slack Loses $8M to Outages

On July 22, 2019, Slack was in the middle of deploying an update to their desktop app. The update was supposed to decrease memory consumption and increase load time, but instead the company suffered a significant, widespread outage on a global scale. After approximately 40 minutes of downtime, the service was back up. But in the meantime, the company whose motto is ‘where work happens’ essentially stopped working.

Creating an Alert in Anodot is Now Easier Than Ever

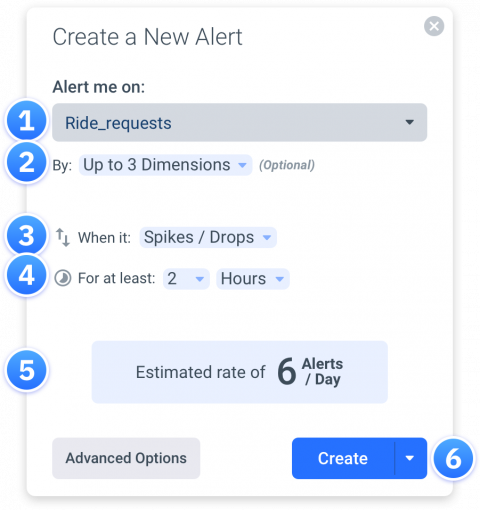
When you first set up your Anodot account, you create alerts on the KPIs that matter most to you. Advanced alert configurations enable you to define various parameters so that you only get alerts that are important to you: selecting the metric, building a query, grouping the data by dimensions, selecting triggers and conditions, choosing who and where it should be sent to, and so on.

Atlassian: Anodot is our 'Safety Net'

With AI analytics slated as the biggest disruptor to big data and analytics, data leaders are quickly integrating this capability into their data strategy. Itzik Feldman, data engineering manager at Atlassian, the enterprise software company responsible for Jira and Trello, recently credited Anodot with helping keep the company’s 3,000 employees in touch with product performance and customer experience.

Leading Chief Data Scientists Weigh in on Building Time Series Anomaly Detection

In our recent webinar on what it takes to build time series anomaly detection, industry experts Arun Kejariwal, Ira Cohen and Ben Lorica shared valuable advice for ways to successfully implement and execute anomaly detection systems in today’s increasingly complex corporate world.

Gartner Lists Anodot as a Leading AIOps Vendor

A recent report by Gartner casts light into the world of AIOps, and the need for deploying it in organizations today. AIOps is a modern approach to DevOps which is based on recent AI technology. Gartner’s vision of the AIOps platform is one that enables continuous insights across IT operations management.

5 Best Practices for Using AI to Automatically Monitor Your Kubernetes Environment

If you happen to be running multiple clusters, each with a large number of services, you’ll find that it’s rather impractical to use static alerts, such as “number of pods < X” or “ingress requests > Y”, or to simply measure the number of HTTP errors. Values fluctuate for every region, data center, cluster, etc. It’s difficult to manually adjust alerts and, when not done properly, you either get way too many false-positives or you could miss a key event.

AI/ML - Are We Using It in the Right Context?

There used to be a distinct, technical separation between terms such as AI and machine learning (ML) – but only while these technologies remained largely theoretical. As soon as they became practical in the real world, and then commodifiable into products, the marketers stepped in. Widespread overuse of the terms AI/ML in marketing have managed to thoroughly confuse the meanings of these words.

Glitch List: June 2019

To keep you up-to-date with what’s going on in anomaly detection, we keep an ongoing list of the biggest glitches happening in the business world. Here is what made waves in June. June 25, 2019 When Dutch telco KPN suffered a major outage on the evening of Tuesday, June 25, the 112 emergency number was also knocked out across the country. “We have no reason to think it was (a hack) and we monitor our systems 24/7,” the company spokesperson told Reuters.