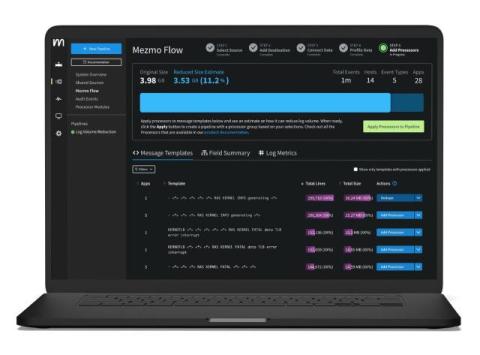
Most vendor trials take quite a bit of effort and time. Now, with Mezmo’s new Welcome Pipeline, you can get results with your Kubernetes telemetry data in just a couple of minutes. But first, let’s discuss why Kubernetes data is such a challenge, and then we’ll overview the steps.
Logs are like gold ore. They have valuable nuggets of information, but those nuggets often come in a matrix of less helpful material. Extracting the gold from the ore is crucial because it is vital to unlocking insights and optimizing your system(s). Raw logs can be overwhelming, containing informational messages, debug statements, errors, etc. However, buried within this sea of data lies the key metrics you can use to understand your applications' performance, availability, and health.
The dynamic nature of the IT landscape poses complex challenges for organizations, necessitating the involvement of observability engineers. These skilled professionals have become indispensable in addressing critical pain points and optimizing system performance. In this blog post, we delve into the challenges observability engineers face and showcase how Mezmo's comprehensive telemetry solution empowers them to overcome these hurdles and achieve optimal results.
The observability landscape is constantly changing and evolving. Despite this, one question often plagues operations leaders: "How can we consolidate disparate data sources and tools to view system performance comprehensively?" These leaders have sought the answer in a single-pane-of-glass solution. However, as Jason Bloomberg and Buddy Brewer discussed in the Mezmo webinar "Solving the Single Pane of Glass Myth," this idea is more myth than reality.
Data explosion is prevalent and impossible to ignore in today’s business landscape, with organizations face a pressing challenge: the ever-increasing volume of log data. As applications, systems, and services generate a torrent of log entries, it becomes crucial to find a way to navigate this sea of information and extract meaningful value from it. How can you turn the overwhelming volume of log data into actionable insights that drive business growth and operational excellence?
Log data is the most fundamental information unit in our XOps world. It provides a record of every important event. Modern log analysis tools help centralize these logs across all our systems. Log analytics helps engineers understand system behavior, enabling them to search for and pinpoint problems. These tools offer dashboarding capabilities and high-level metrics for system health. Additionally, they can alert us when problems arise.
Growth of cloud computing and the preference for data-driven decision-making have led to a steady increase in investments in observability over the years. Telemetry data is recognized as not only critical for maintaining a company’s infrastructure, but also for aiding security and business teams in making informed decisions. However, just increasing investment in observability technology is not enough.
In modern business environments, where everything is fast-paced and data-centric, companies need to be able to track and analyze data quickly and efficiently to stay competitive. Metrics play a crucial role in this, providing valuable insights into product performance, user behavior, and system health. By tracking metrics, companies can make data-driven decisions to improve their product and grow their business.
Mezmo Telemetry Pipeline helps organizations Ingest, transform, and route telemetry data to control costs and drive actionability. Modern organizations are adopting telemetry pipelines to manage challenges with telemetry data (logs, metrics, traces, events) growth and to get the most value from their data investments.