Operations | Monitoring | ITSM | DevOps | Cloud

How to Reduce Your Cloud Costs with Coroot

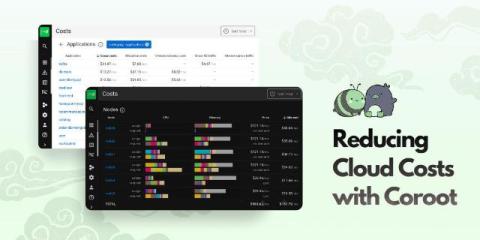
Cloud costs often grow quietly until they suddenly command everyone’s attention. Gartner estimates that companies overspend on cloud services by up to 70 percent, mostly because they lack clear visibility into where the money is actually being spent. Cloud invoices speak the language of infrastructure: nodes, instance types, regions, volumes, and egress. Engineering teams speak the language of services, deployments, and code.

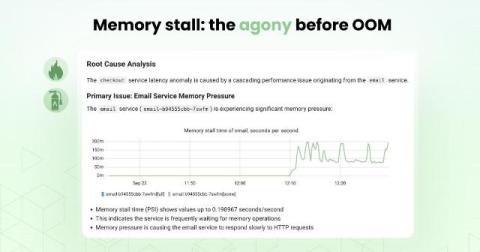
Memory stall: the agony before OOM

When we set a memory limit for a container, the expectation is simple: if the app leaks memory, the OOM killer steps in, the container dies, Kubernetes restarts it, done. But reality is messier. As a container gets close to its memory limit, allocations don’t just fail instantly. They get slower. The kernel tries to reclaim memory inside the cgroup, and that takes time. Instead of being killed right away, your app just crawls.

Instrumenting the Node.js event loop with eBPF

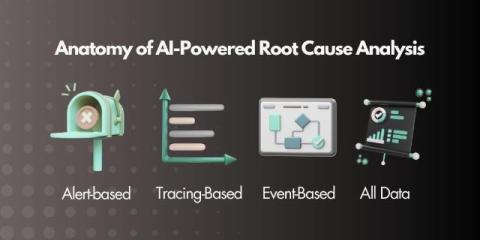
Recently, I was testing Coroot’s AI Root Cause Analysis on failure scenarios from the OpenTelemetry demo. One of them, loadgeneratorFloodHomepage, simulates a flood of excessive requests. As expected, it caused a latency degradation across the stack. Coroot’s RCA highlighted how the latency cascaded through all dependent services. At the same time, we noticed a moderate increase in CPU usage for the frontend service and the node itself.

Using GreptimeDB as Prometheus Data Lake in Coroot

Coroot is excited to feature an editorial from the open source observability database GreptimeDB as an Open Source Spotlight. We hope to improve the work of our global community of SREs and DevOps professionals by sharing exciting projects like GreptimeDB, which make innovation accessible for everyone through the freedom of open source.

Size-capped telemetry storage with ClickHouse and Coroot

Cloud platforms make it incredibly easy to store data. Object storage feels endless, and block volumes can be resized anytime. That’s great, until you check the cost. In some cases, like financial transactions, storage costs are tiny compared to the value of the data. But observability is a different story. Logs, traces, and profiles can be extremely detailed and often take up more space than the actual business data. Yes, there are situations where logs need to be kept for compliance reasons.

Arie's Adventures with Coroot

Arie van den Heuvel is an engineer, a System and Application Management Specialist, and a valued member of our community. Below he has shared his journey using Coroot, and how it has helped improve observability for his team. You can read more of Arie’s writing and support the resource articles he has created for open source on his blog.

OpenTelemetry for Go: measuring the overhead

Everything comes at a cost — and observability is no exception. When we add metrics, logging, or distributed tracing to our applications, it helps us understand what’s going on with performance and key UX metrics like success rate and latency. But what’s the cost? I’m not talking about the price of observability tools here, I mean the instrumentation overhead.

Working with GPUs on Kubernetes and making them observable

GPUs are everywhere powering LLM inference, model training, video processing, and more. Kubernetes is often where these workloads run. But using GPUs in Kubernetes isn’t as simple as using CPUs. You need the right setup. You need efficient scheduling. And most importantly you need visibility. This post walks through how to run GPU workloads on Kubernetes, how to virtualize them efficiently, and how Coroot helps you monitor everything with zero instrumentation or config.