Operations | Monitoring | ITSM | DevOps | Cloud

Latest Posts

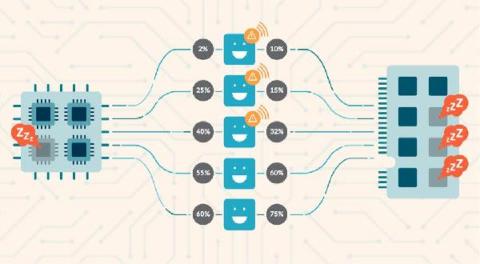
Detecting and Mitigating CVE-2021-25737: EndpointSlice validation enables host network hijack

The CVE-2021-25737 low-level vulnerability has been found in Kubernetes kube-apiserver where an authorized user could redirect pod traffic to private networks on a Node. The kube-apiserver affected are: By exploiting the vulnerability, adversaries could be able to redirect pod traffic even though Kubernetes already prevents creation of Endpoint IPs in the localhost or link-local range.

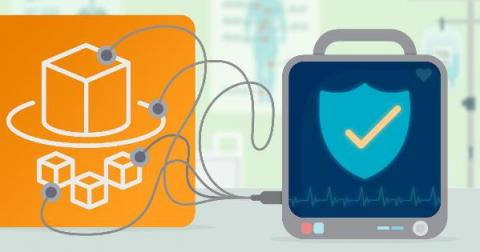
Securing the new AWS App Runner service

In its mission to simplify building and running cloud-native applications for users, Amazon has announced the GA of AWS App Runner, a new purpose-built container application service. With security top of mind for most organizations shifting to the cloud, Sysdig has collaborated with AWS to enable threat detection for the new platform.

Top 10 metrics in PostgreSQL monitoring with Prometheus

PostgreSQL monitoring with Prometheus is an easy thing to do thanks to the PostgreSQL Exporter. PostgreSQL is an open-source relational database with a powerful community behind it. It’s very popular due to its strong stability and powerful data types. In this article, you’ll learn the top 10 metrics in PostgreSQL monitoring, with alert examples, both for PostgreSQL instances in Kubernetes and AWS RDS PostgreSQL instances.

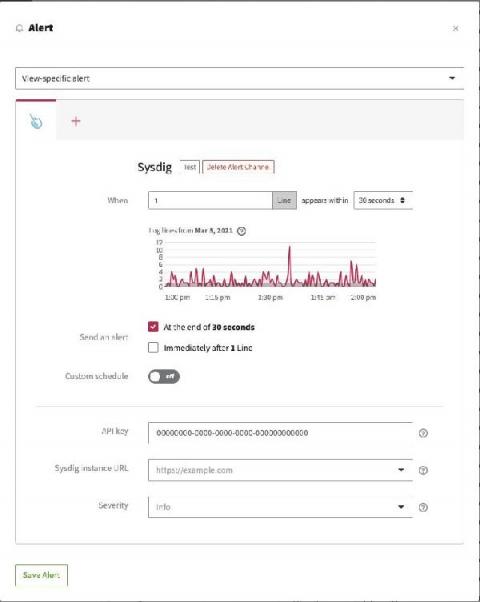
See your logs and metrics together with LogDNA and Sysdig integration

Observability is the key to solving problems quickly, and organizations use many tools to try to increase visibility in their environments so they don’t miss anything. Typical sources of observability include metrics, logs, and traces. The foundation of monitoring, metrics are predictable counts or measurements that are aggregated over a specific period of time. Timestamped records of discrete events that can store outputs from applications, systems, and services.

Kubernetes capacity planning: How to rightsize the requests of your cluster

Kubernetes capacity planning is one of the main challenges that infrastructure engineers have to face, as understanding Kubernetes limits and requests is not an easy thing. You might be reserving way more resources than you need to ensure your containers don’t run out of memory, or are CPU throttled. If you are in this situation, you’re going to be charged for those resources even if they aren’t being used, and it will also make deployments more difficult to schedule.

Digging into AWS Fargate runtime security approaches: Beyond ptrace and LD_PRELOAD

Fargate offers a great value proposition to AWS users: forget about virtual machines and just provision containers. Amazon will take care of the underlying hosts, so you will be able to focus on writing software instead of maintaining and upgrading a fleet of Linux instances. Fargate brings many benefits to the table, including small maintenance overhead, lower attack surface, and granular pricing. However, as any cloud asset, leaving your AWS Fargate tasks unattended can lead to nasty surprises.

Unravel the hidden mysteries of your cluster with the new Kubernetes Dashboards

One of the greatest challenges you may face when creating Kubernetes dashboards is getting the full picture of your cluster. Kubernetes is the de-facto standard for container orchestration, but it also has a very steep learning curve. We, at Sysdig, use Kubernetes ourselves, and also help hundreds of customers dealing with their clusters every day. We are happy to share all that expertise with you in the Kubernetes Dashboards.

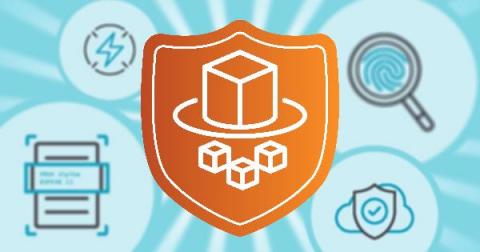
Securing AWS Fargate workloads: Meeting File Integrity Monitoring (FIM) requirements

Securing AWS Fargate serverless workloads can be tricky as AWS does not provide much detail about the internal workings. After all… it’s not your business, AWS manages the scaling of underlying resources for you. :) While the security and stability of Fargate’s system is an inherent feature, Fargate follows a shared responsibility model, where you still have to take care of securing those parts specific to your application..

How to monitor Microsoft SQL Server with Prometheus

In this article, you will learn how to monitor SQL Server with Prometheus. SQL Server is a popular database, which is very straightforward to monitor with a simple Prometheus exporter. Like all databases, SQL Server has many points of failure, such as delays in transactions or too many connections in the database. We are basing this guide on Golden Signals, a reduced set of metrics that offer a wide view of a service from a user or consumer perspective.