Terraform state is critical for monitoring and keeping track of configuration changes. Check out this short to learn more about Terraform state and its importance.
Cloud Armor allows you to easily monitor your data and have peace of mind that your policies are running correctly. In this episode of Go Deep with Google Cloud Armor, we cover preconfigured and custom dashboards, Security Command Center, and using Looker for more powerful dashboarding to get even better insights from your Cloud Armor data. Watch to learn how you can use Google Cloud Armor for all your monitoring needs!
Would you like to know how to manage your workloads efficiently? Are you interested in learning how to share the slots across different workloads/projects?
Have you ever received an unexpected Cloud Alerting incident? Would you like to learn how to prevent unexpected alerts? In this video, we cover some key concepts related to Alert Policy configuring in Google Cloud Monitoring. We’ll show you how to troubleshoot two unexpected incidents one on Metric and one on Log based metric alerting policies and explore configuration improvements to prevent future false alerts.
Welcome back to GKE Essentials! In this episode, Kaslin Fields explores a key element of your GKE observability: Google Cloud Managed Service for Prometheus. Watch to see how Google Cloud's fully managed multi-cloud solution for Prometheus lets you globally monitor and alert on your workloads without having to manually manage and operate Prometheus at scale.
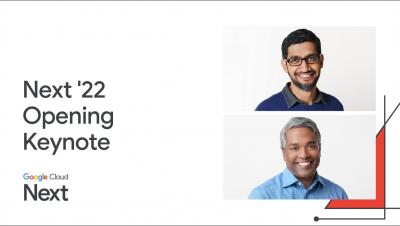
Google Cloud CEO Thomas Kurian shares insights on how businesses are using cloud technology to build for the future and adapt to complexities, challenges, and opportunities.
Are you interested to know about alerts in Cloud Monitoring? Would you like to know how to create metric based alerts for Google cloud products through cloud monitoring? In this video we introduce you to Alerts in Cloud Monitoring, how it works, the different types of alerting policies. Watch this video to learn how to create metric based alerts for Google cloud products.
As an SAP system administrator, you've probably asked yourself: why did my Compute Instance restart? Why did Pacemaker restart my instance? Why did/didn’t my SAP system failover? By streaming Pacemaker logs into Cloud Logging, you can now find the answers to these questions by using a Cloud Logging query template to filter out the noise generated by Pacemaker logs.
Do you have workloads that generate logs inside your Google Compute Engine (GCE) instances? Would you like to troubleshoot your application directly from Google Cloud Platform? Then check out this video to learn how to install and configure the Ops Agent to stream any third party application log into Cloud Logging.