Operations | Monitoring | ITSM | DevOps | Cloud

The Place Where Modern Operations & Technology Come Together


LeadDev Live 2021- Habits of highly-performing teams
There is a yawning gap opening up between the best and the rest — the elite top few percent of engineering teams are making incredible gains year over year in reliability and lack of technical drag forces, while the bottom 50% are losing ground. Take an engineer out of an elite-performing team and place them in the bottom 50%, and they become subpar too; take an engineer out of a mediocre team and embed them in an elite team, and they are pulling their weight within the year. I will share with you everything I know — everything that went into building a high-performing team at Honeycomb.
Honeycomb Product Demo
Six-minute Honeycomb Product demo with Nathan LeClaire
Building w/ Observability- Honeycomb & CircleCI
Do you know exactly what your builds are doing at every step of the way to prod and after they’ve been deployed? A key part of what lets you ship code to production often and quickly is having observability in your builds. Together, CircleCI and Honeycomb can help you get both speed and quality when shipping code to production. In this webinar, we’ll not only examine how CircleCI and Honeycomb work well together, we’ll also look at how Honeycomb used both products together to identify changes that impacted their build times and reduced them by 25%.

Operations - Past, Present and Glorious Future
People with infrastructure experience and operational experience like “DevOps Engineer”, “SRE”, “Platform Engineer” have started to see those two skill sets diverge. It’s not very clear what that split means for these skilled technical people as they approach the next phase of their careers.


Raw & Real Ep 7 The Tracing You Deserve So You Can Observe
Distributed tracing is key to building and operating reliable services that make your customers happy. Traces pinpoint where failures occur and what causes poor performance. With tracing and observability, you can visualize the entire life cycle of service requests and discover hidden latency, errors, and optimization opportunities monitoring can’t show you. So why doesn’t everybody do it? Setting up tracing is notoriously difficult, but it doesn’t have to be. Honeycomb Instrumentation Engineer Paul Osman has the easy-breezy steps for you to get the tracing you deserve.

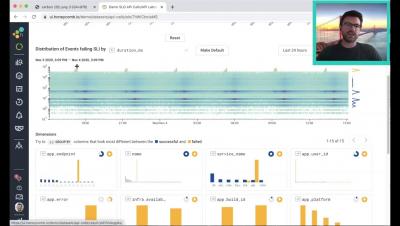
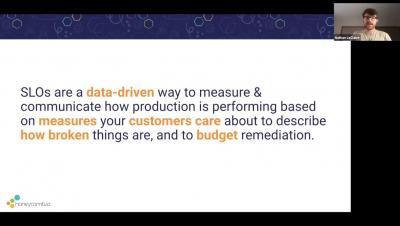
Define Success- The Right SLOs for Your Business
SLOs help you understand how your system works so that you know how to measure it. Dive deep into Honeycomb SLOs and determine the right path for your business.

SLO Theory- Why the Business needs SLOs
Now engineering and business speak the same language. Find out why you should care, how SLOs are critical to SRE practice, & how to keep your customers happy.
Get Started- Build One Simple SLO
Clover Health puts patients and care providers first. Learn how they derived their first SLO for the benefit of those who matter most - their customers.