Operations | Monitoring | ITSM | DevOps | Cloud

Latest Videos

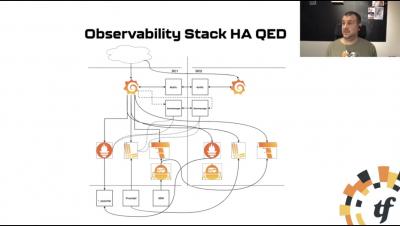
Bootstrapping a multi DC cloud native observability stack by Bram Vogelaar

An introduction to Observability and how to setup a highly available monitoring platform, across multiple data centers. During this talk we investigate how to config a monitoring setup across 2 DCs using Prometheus, Loki, Tempo, Alertmanager and Grafana. Bram Vogelaar spent the first part of his career as a Molecular Biologist, he then moved on to supporting his peers by building tools and platforms for them with a lot of Open Source technologies. He now works as a DevOps Cloud Engineer at The Factory.

Query your nginx/envoy/syslog logs easier and way faster with the new Grafana Loki pattern parser.

Loki 2.3 introduces the pattern parser. Patterns are way simpler to write than Regex. As an added bonus, it's an order of magnitudes faster than the Loki regex parser. This means that you can now query way more semi-structured logs (nginx/envoy/syslog and more) in less time than before.

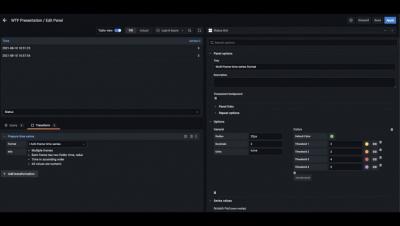
WTF! Migrating to Grafana's wide time series format presented by Stephanie Closson

The wide time series format was introduced in Grafana 7.5, and has been the standard for time series data since. This new format does not work well with older panels though. WTF? Learn how to spot time series format issues, and solve them. Presented by Stephanie Closson, Software Engineer at Grafana Labs at Grafana East Coast Virtual Meetup - August 2021

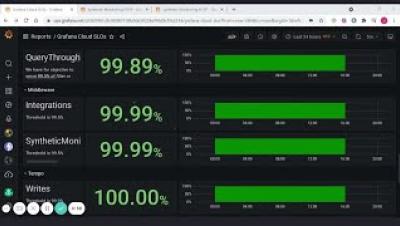
SLOs, SLIs, and where to find them with Jacob Plicque III

Identifying the right the right Service-Level Indicators is mission-critical for any SRE team responsible for meeting Service-Level Objectives and reporting on them. Find out how to sift through mountains of metrics and fill gaps in your data in order to visualize SLIs that actually matter for effective error budget tracking and actionable alerts in Grafana. Presented by: Jacob Plicque III, Senior Engineer at Grafana Labs at Grafana East Coast Virtual Meetup - August 2021

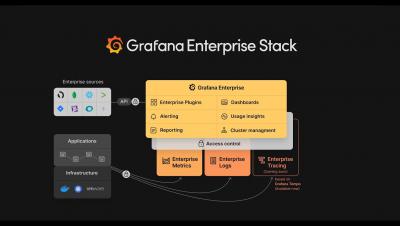
The Grafana Enterprise Stack in less than 3 minutes

Grafana Labs is the open & composable observability company. In just over 6 years, our namesake product, Grafana, has become the world's #1 dashboarding service for time series data with over 6 million users. And we've been recognized as a leader in the space. Grafana Labs has built the world's first open & composable observability stack -- and it's natively designed for monitoring hybrid-cloud, container, and microservices environments.

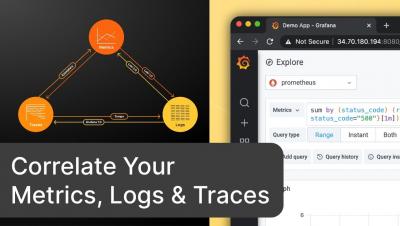
Correlate Your Metrics, Logs & Traces with the curated OSS observability stack from Grafana Labs

Correlation between metrics, logs, and traces should be as effortless as possible. This helps you make better decisions and actions. The Grafana Labs open-source observability stack enables powerful correlations between your metrics, log, and traces. The key here is to have consistent metadata across the three pillars of observability. Let me demo you how this works in this video.