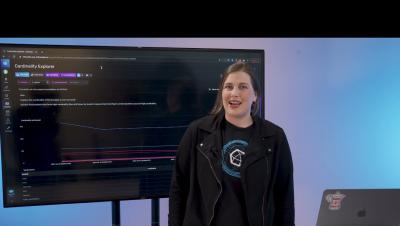
With InfluxDB Annotations, drop a note directly on a graph to explain the why behind time series data trends. Quickly determine root cause and restore services faster with team members sharing contextual clues: software deployments, configuration changes, service outages, and more.
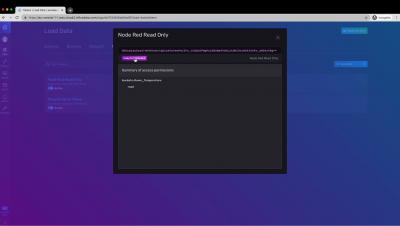
This video shows you how to take data that is stored in InfluxDB Cloud 2 and use it in a "Switch" node within Node-Red. In our example, we read the average house temperature and decide whether or not the heating should be switched on.
Virtual Time Series Meetups are events for everyone who is passionate or curious about time series data and how it can be used. In the April 2021 edition, Mirko D. Comparetti shares how he use InfluxDB to monitoring his internet service provider.
This video shows you how to take data that is stored in InfluxDB Cloud 2 and use it in a "Switch" node within Node-Red. In our example, we read the average house temperature and decide whether or not the heating should be switched on.
Are you looking for a low-code platform to help you get the most out of your time-stamped data from servers, sensors and systems? Find out if the InfluxDB Cloud time series platform is right for you.
This talk shows how to use Tasks, Flux, dashboards and monitoring and alerting in InfluxDB Cloud to create an external service or website monitor. This video is a simple example for everyone to use as a template for their own custom monitoring applications built on top of InfluxDB Cloud.
Notebooks is currently an early-access feature on InfluxDB Cloud. Notebooks let you create documents with live code, equations, visualizations and explanatory notes and save outputs as dashboards or schedule to repeat as tasks. Downsample data to reduce the overall disk usage as data collects over time.