Pivoting InfluxDB Series Data into Relational Layouts
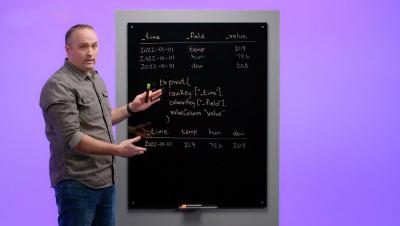
Most developers are more familiar with the shape of relational data than the shape of time series data. InfluxDB stores time series data in such a way to maximize its effectiveness. As developers get more familiar with time series data, it may be helpful to view time series data in a relational layout. Fortunately, Flux language makes it easy to present your time series data the way that's useful for you.


