Splunk Platform Demo
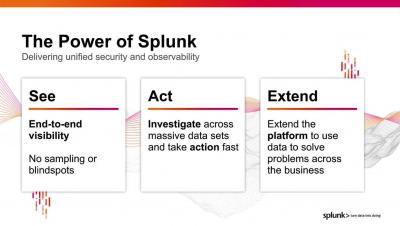
Splunk Platform enables you to search, analyze, and visualize your data across your technology landscape. Take a look at how Splunk offers an extensible data platform that powers unified security, full-stack observability, and limitless customer applications. This Splunk Platform overview and demo will show you how Splunk can help you make data transformations to further accelerate your cloud-driven initiatives.