Simplifying ESX monitoring with OpManager
IT admins have to adapt to new market trends and networking concepts to meet ever-evolving IT demands. However, solely relying on physical components to support this changing landscape puts them at a disadvantage when it comes to scalability, network distribution, and cost-effectiveness. To remove the strain on physical components such as servers and to keep the capital expense in the optimal range, IT admins rely on virtualization. Most networks have started adopting virtualization even for their most resource-intensive applications. Virtualization has thus far proven to be a better alternative to physical components with its improved flexibility and scalability and its reduced capital and operating expenses.
However, like all other network components, virtual components can run into issues without the right monitoring solution in place. This is where ManageEngine OpManager helps you. This enterprise-grade network monitoring software offers proactive virtual device monitoring that allows you to maximize performance and stay ahead of issues. Let's look into how to make the most out of your VMware Elastic Sky X (ESX) by using OpManager's ESX monitor.
What you should know about ESX
In the virtual products sector, VMware is a leading vendor with a VM suite that is considered to be one of the most reliable solutions in the industry. ESX is a part of VMware's server virtualization product line. As a Type 1 bare-metal hypervisor, ESX is designed to be installed directly on top of the physical server, eliminating the need for an OS. ESX allows you to build a logical pool of network resources to create multiple VMs, each configured with its own networking capability.
Why you need an ESX monitoring tool
ESX undoubtedly helps many organizations effectively implement virtualization and make use of multiple VMs at a time. However, a reliable ESX monitoring tool needs to be in place to avoid network issues. A comprehensive tool such as OpManager:
Runs performance evaluations: A crucial way of avoiding issues with virtual components is keeping track of their performance metrics constantly. Performance degradation can indicate a potential network issue.
Checks hardware resource usage: The resource usage of the hardware on which the ESX host runs needs to be monitored constantly. Any issues, such as insufficient storage or memory, can lead to performance degradation of the applications running on the VMs.
OpManager's ESX monitoring: Monitor, troubleshoot, and automate with ease
OpManager monitors your ESX servers for crucial availability and performance metrics using built-in APIs. You can also use SNMP, WMI, or CLI credentials to gain in-depth insights into your virtual devices. With its ESX monitoring capability, OpManager enables you to:
- Discover ESX hosts and monitor their performance metrics with ease.
- Troubleshoot issues effectively with instant, threshold-based alerts.
- Automate monotonous tasks and reduce manual intervention.
Discover ESX hosts and monitor their performance metrics
Discovering ESX hosts and VMs needn't be an arduous task if you have the right network discovery tool in place. With OpManager, discovering a host and VMs becomes a simple two-step process. First, configure your ESX credentials as credential profiles. Second, discover different VMs with just a click by specifying their IP or DNS names.
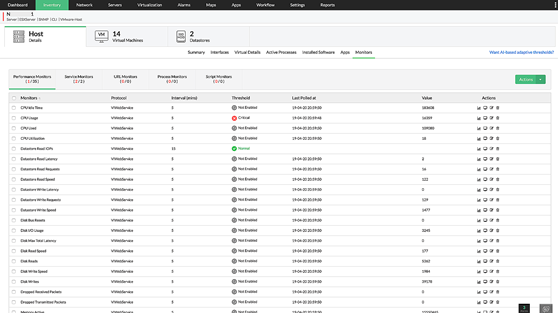
With this simplified discovery process, monitoring ESX performance becomes hassle-free. OpManager automatically starts scanning your ESX host and VMs once they are discovered. It displays in-depth insights into the host, its associated VMs, and datastores. Clicking the Host tab offers you a device snapshot: a look into its availability, packet loss, response time metrics, and recent alarms. You can set up custom dials to monitor crucial performance metrics, such as CPU utilization and disk I/O usage, at a glance.
Troubleshoot issues effectively with instant, threshold-based alerts
While OpManager's real-time tracking and graphing of metrics lets you effectively monitor your ESX servers, it also keeps you ahead of potential network issues. When OpManager discovers ESX, it automatically associates a predefined set of performance monitors and optimal thresholds with it. You can set up different threshold levels, such as attention, trouble, and critical, for the different ESX servers monitored. You can also set an alarm rearm value to stay aware of fluctuating values and determine when the monitor status should be returned to normal.

Once a threshold is set up, OpManager automatically monitors the devices for any threshold violations. If one is found, it instantly alerts you through the channel of your choice, such as email or syslog. Adaptive threshold-based alerts simplify the process of network troubleshooting. You can also set up alarm escalation rules to escalate unattended or missed alarms to team members through email or SMS.

Automate monotonous tasks and reduce manual intervention
Monotonous network tasks can take up a huge chunk of your IT team's time. Automating these tasks helps your team focus on other responsibilities that demand attention. Tired of troubleshooting recurring issues in your ESX server? Automate the process by setting up a workflow using OpManager. Once set up, the workflow gets automatically triggered every time a configured scenario occurs, without any manual intervention.

You can also automate tasks such as network discovery and rediscovery by setting up the required time intervals. Once set, OpManger automatically scans your network and updates the monitored details in real time.

OpManager offers more than just VMware monitoring. Learn more about this complete network monitoring solution by connecting with our product experts for a personalized, live demo. Explore how it helps you seamlessly maintain constant network uptime, monitor crucial performance metrics, and troubleshoot with ease. To try it for yourself and learn how it can integrate with your existing network infrastructure, download a free, 30-day trial of OpManger!

