Operations | Monitoring | ITSM | DevOps | Cloud

Squared Up

Dashboard Server: Working with the SQL tile

In my previous blogs in the Dashboard Server Learning Path, we looked at working with the Web API tile and the PowerShell tile. In this instalment, let’s try the SQL tile. This tile will let you connect to any SQL database and run a SQL query straight from SquaredUp. This tile is also available in both the SquaredUp for SCOM and Azure products, so I have some familiarity with it already.

Dashboard Server: Working with the PowerShell tile

Amongst all the cool features of SquaredUp Dashboard Server, the coolest kid on the block is probably the PowerShell tile. The reason is simple – PowerShell is easy, it’s awesome, and it’s powerful! You can not only retrieve data from the source (like the APIs), but you can also manipulate that data, work with variables, loop it, filter it, and use it in whichever way works the best. Like they say, the things PowerShell can do are only restricted by the proficiency of the user.

The benefits and challenges of a single pane of glass

SCOM 2019 is a monitoring powerhouse. Its capabilities are unmatched. But it also has some serious issues when it comes to unearthing and visualizing the valuable data locked inside. The replacement of Silverlight with HTML5 in the SCOM 2019 web console was a welcome enhancement, but the SCOM web console still shares its design with the administration console, which is slow, complex, and makes it downright difficult to get the visibility you need.

How to build insightful M365 Analytics Dashboards with SquaredUp and Microsoft Graph API (Part 2)

In the last blog post, I walked you through how to connect to the Microsoft Graph API so you can start pulling in the M365 analytics to create a dashboard in SquaredUp. In this blog post, I’ll walk you through exactly how to create this dashboard. This dashboard will allow you to monitor key metrics for Microsoft 365 SharePoint, Exchange Online, and Teams so you can be proactive in assigning storage.

Dashboard Server: Working with the WebAPI tile

Now that we’ve familiarized ourselves with the basics, let’s get on creating our first dashboard! I spot an familiar tile here, the WebAPI tile. This tile is available in the SquaredUp SCOM and Azure products too. WebAPI tile is the way you bring external data into SquaredUp. As long as the tool you’re connecting to has an API endpoint that returns data in JSON payload, you can work with that data to display the data in a dashboard in SquaredUp.

How to build insightful M365 Analytics Dashboards with SquaredUp and Microsoft Graph API (Part 1)

It’s incredibly helpful to be able to visualize the data produced by your organization’s M365 tenant so you can manage licenses, usage, capacity, and more. SquaredUp dashboards are ideal for this. You can use the WebAPI Tile in SquaredUp to connect to the Microsoft Graph API, which offers a broad set of functionalities for working with Azure via code. Microsoft 365 sits on top of Azure and can be managed via Graph API, too.

Getting started with Dashboard Server

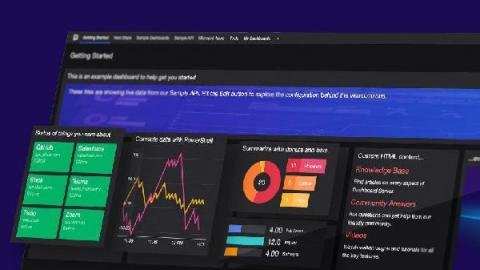
SquaredUp Dashboard Server lets you and your team create beautiful dashboards, for any tool or data, that you can share with everyone in your organization. Here’s a quick introduction to the product where we show you exactly what you can achieve, in no time at all. Let’s start with the three tabs on the top left of the screen: Getting Started, Next Steps, and Sample Dashboards. We’ll run through them one by one.

Dashboard Server Product Preview

How would your IT team be transformed if you could dashboard anything, for free? Find out on 25th March at 2pm as we introduce you to SquaredUp Dashboard Server. Combining the best of SquaredUp with a powerful Powershell integration, Dashboard Server allows you to dashboard virtually any data, and is made for IT pros looking for a tool that’s quick to implement, easy to set up, and effortless to maintain.