Meet MicroStack
MicroStack effectively eliminates the complexity behind OpenStack, providing an opinionated approach to OpenStack architecture design and a straightforward installation method..


Application performance monitoring tools, or APMs, help give developers feedback so they can understand whether their programs are working the way they had planned for their users and clients. It also provides information about the software’s quality. Most DevOps teams use these tools throughout the software development life cycle. This way, they make sure that they cover their grounds before releasing software into the market.
Learn how to test your HAProxy Configuration. Properly testing your HAProxy configuration file is a simple, yet crucial part of administering your load balancer. Remembering to run one simple command after making a change to your configuration file can save you from unintentionally stopping your load balancer and bringing down your services.
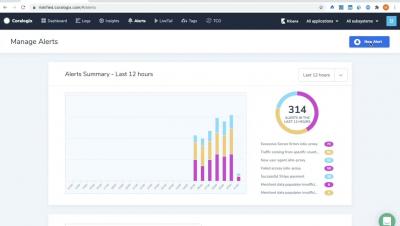
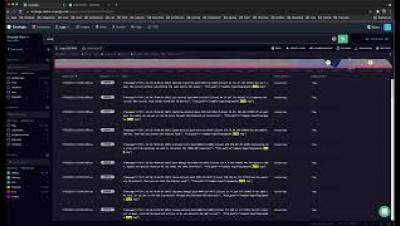
As APIs become more complex, it can be easy to accidentally break connections. To prevent this, Speedscale can automatically detect and make you aware of inbound and outbound transactions running through APIs in our API Dependency Graph. The Traffic Viewer dashboard makes this information visible to independent teams working on different services. In most organizations this information is usually only known by senior engineers, team leads, and architects.