Operations | Monitoring | ITSM | DevOps | Cloud
Synthetic Monitoring: What is it, Challenges, and How to Get Started
With Infrastructure as Code and service-oriented development, a modern web app can consist of countless moving parts developed by multiple development and DevOps teams. When establishing a high-velocity development environment, the main question is, "How can you guarantee a stellar end-user experience when lots of engineers are constantly pushing and deploying code?" Solid, easy-to-write, and clearly defined monitoring practices are the only answer to this question.
Ensuring a reliable end-user experience with synthetic monitoring
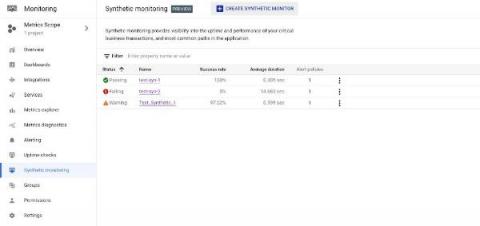
Synthetic monitoring in Cloud Monitoring lets you test the availability, consistency, and performance of your web applications from the perspective of a real user.
2 Steps Citrix Example
2 Steps Presentation at CUGXL ANZ
How Coralogix Powers Your Synthetic Monitoring with Checkly
As a leading full-stack observability platform, Coralogix enables you to gather, monitor and analyze your infrastructure and application telemetry. And Coralogix now offers synthetic monitoring for proactive end-to-end testing across development with Checkly.
Synthetic Monitoring for Microsoft Azure DaaS
The adoption of Microsoft Azure Desktop as a Service (DaaS) has significantly improved how businesses access and manage their desktop environments. However, as the number of users relying on DaaS increases, ensuring a seamless and reliable user experience becomes increasingly challenging. This blog post will explore businesses' key challenges in monitoring Microsoft Azure DaaS and how Synthetic Monitoring can help ensure a seamless user experience.
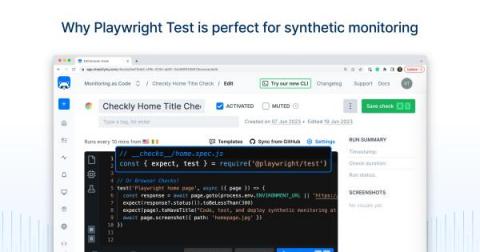
Synthetic Monitoring With Checkly and Playwright Test
One of the most effective ways to monitor a critical user flow on a website—or monitor the operation of a critical API that other applications depended on—is to adopt synthetic monitoring. Synthetic monitoring is an approach to monitoring websites and applications that simulates the actions of real users via browser automation. It mirrors the actions that a visitor may take on your website, say browsing an online shop, adding items to a shopping cart, and then checking out.
Optimize your frontend monitoring strategy with Datadog Synthetic Monitoring and RUM
Testing enables you to proactively identify and resolve issues before they break critical functionality in your application, which is essential to ensuring an optimized user experience (UX). However, if you don’t know how users are actually interacting with your application, key user journeys may go untested. This lack of visibility can lead to a proliferation of unoptimized features in your UI, causing users to drop off before completing important actions.


