Operations | Monitoring | ITSM | DevOps | Cloud

Google Operations

Use the Dashboard API to build your own monitoring dashboard

Using dashboards in Cloud Monitoring makes it easy for you to track important system metrics. Creating dashboards by hand in the Monitoring UI can be a time-consuming process, especially if you want to use them in multiple different Monitoring Workspaces. With the recent GA announcement for the Cloud Monitoring dashboards API, you now have a way to programmatically create dashboards.

Stackdriver Push to Splunk

During my career (in technology), I have dealt with many clients to whom security was one of the main areas of concern. As such, there’s always room for improvement but without a shed of a doubt, communications direction and stateful firewalls are some of the very first elements to consider. When it comes to logging and audit information, as a rule of thumb, it’s good to have a log aggregator stored outside of the scope of a cloud provider. A great log correlation out there is Splunk.

All together now: our operations products in one place

Our suite of operations products has come a long way since the acquisition of Stackdriver back in 2014. The suite has constantly evolved with significant new capabilities since then, and today we reach another important milestone with complete integration into the Google Cloud Console. We’re now saying goodbye to the Stackdriver brand, and announcing an operations suite of products, which includes Cloud Logging, Cloud Monitoring, Cloud Trace, Cloud Debugger, and Cloud Profiler.

Integrating Tracing and Logging with OpenTelemetry and Stackdriver

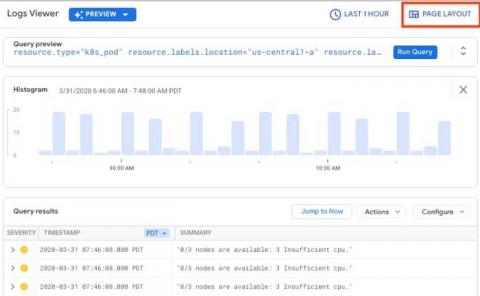
One of the main benefits of using an all-in-one observability suite like Stackdriver is that it provides all of the capabilities you may need. Specifically, your metrics, traces, and logs are all in one place, and with the GA release of Monitoring in the Cloud Console, that’s more true than ever before. However, for the most part, each of these data elements are still mostly independent, and I wanted to attempt to try to unify two of them — traces and logs.

Introducing the Stackdriver Cloud Monitoring dashboards API

Using dashboards in Stackdriver Cloud Monitoring makes it easy to track critical metrics across time. Dashboards can, for example, provide visualizations to help debug high latency in your application or track key metrics for your applications. Creating dashboards by hand in the Monitoring UI can be a time-consuming process, which may require many iterations. Once dashboards are created, you can save time by using them in multiple Workspaces within your organization.

Logging + Trace: love at first insight

Meet Stackdriver Logging, a gregarious individual who loves large-scale data and is openly friendly to structured and unstructured data alike. Although they grew up at Google, Stackdriver Logging welcomes data from any cloud or even on-prem. Logging has many close friends, including Monitoring, BigQuery, Pub/Sub, Cloud Storage and all the other Google Cloud services that integrate with them. However, recently, they are looking for a deeper relationship to find insight.

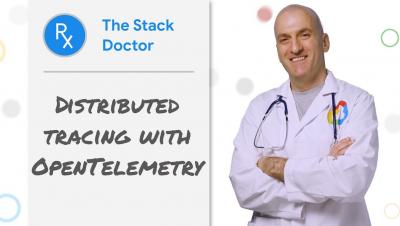
Stackdriver Sandbox - Stack Doctor

Want to get started with Stackdriver without impacting your production monitoring setup? Join Yuri Grinshteyn to learn how to use the Stackdriver Sandbox to start learning about and using Stackdriver. The Sandbox includes a GKE cluster with a sample microservices application deployed and fully instrumented for monitoring, logging, and tracing.

SLOs with Stackdriver Service Monitoring

Service Level Objectives or SLOs are one of the fundamental principles of site reliability engineering. We use them to precisely quantify the reliability target we want to achieve in our service. We also use their inverse, error budgets, to make informed decisions about how much risk we can take on at any given time. This lets us determine, for example, whether we can go ahead with a push to production or infrastructure upgrade.