Operations | Monitoring | ITSM | DevOps | Cloud
%term
Super Monitoring Decorated with 2 Distinctions for Application Performance Monitoring Software
Super Monitoring was recently lauded by a popular software review platform for its steadfast assistance in keeping everyone’s business operations smooth and seamless at all times. For its efficiency in informing users regarding emerging issues and anomalous threats, Super Monitoring was distinguished by the FinancesOnline SaaS review platform with two prestigious awards for 2018: Great User Experience and Rising Star.
Alert fatigue, part 1: avoidance and course correction
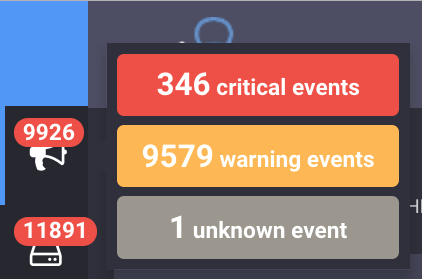
Alert fatigue occurs when one is exposed to a large number of frequent alarms (alerts) and consequently becomes desensitized to them. This problem is not specific to technology fields: most jobs that require on-call, such as doctors, experience it in slightly different manners, but the problem is the same.
Icinga 2 DSL Feature: Namespaces coming in v2.10
Under the hood, Icinga 2 uses many constants and reserved keywords, e.g. “Critical” or “Zone” which are respected by the config parser and compiler. This sometimes leads to errors when users accidentally override such things, or re-define their own global constants. v2.10 introduces namespaces for this purpose, and ensures that such accidents won’t happen anymore.
The strange case of SNMP: A weird story about protocols
A crime had taken place in Manhattan Grow, a well-established company, so to speak, of invoices. Someone shouted “OH MY GOD, WE MUST FIND THE GUILTY ONE! There wasn’t enough coffee and doughnuts in the machine to calm the entire office. In the middle of summer, the sky was slowly walking towards dusk, slowly fading away. No one was going to leave Manhattan Grow until the mess was fixed. Heads were going to roll.
Dashbird product update - September 2018
Over the past year, we’ve seen Dashbird providing increasingly better visibility for developers building serverless applications. One of our goals is to create a product service that gives end-to-end visibility into serverless architectures, one that aligns perfectly with the needs of our clients.
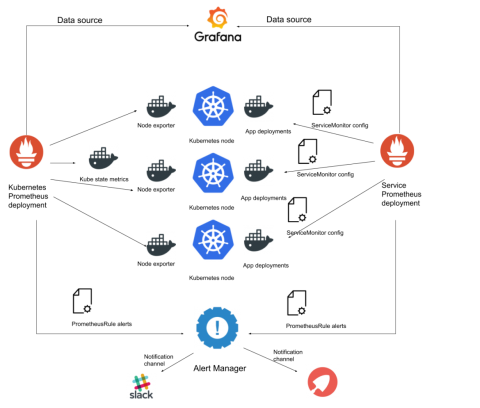
Kubernetes monitoring with Prometheus - Prometheus operator tutorial (part 3).
We covered how to install a complete ‘Kubernetes monitoring with Prometheus’ stack in the previous chapters of this guide. But using the Prometheus Operator framework and its Custom Resource Definitions has significant advantages over manually adding metric targets and service providers, which can become cumbersome for large deployments and doesn’t fully utilize Kubernetes’ orchestrator capabilities.
Creating Dashboards in Sematext Cloud
Need Only the Down or Up Notifications? You are Covered!
Uptime Robot sends notifications for down and up notifications by default for each alert contact type. However, there can be cases where you may only need the down or up notifications.
How IT Pros Can Maximize Efficiency With Uptime.com
IT professionals have to efficiently manage several dozen to several hundred critical pieces of infrastructure a modern business needs to stay afloat. Even smaller businesses often encounter this challenge. We understand that at every level, the time spent researching these issues comes at a cost. That’s why we’ve built some time-saving measures into Uptime.com to help you make more efficient use of your most precious resource: your time.


