Operations | Monitoring | ITSM | DevOps | Cloud

Mezmo

Weekly and Monthly Alert Insights

SRE and Security teams rely heavily on alerts to know whether their systems are experiencing issues and to prevent any future outages. At LogDNA, customers can set alerts that trigger when specific logs match (presence alerts) or set an alert to go off if there are expected lines that haven’t come through (absence alerts). These alerts can be set up with various channels so you can be alerted in the product of your choice (Slack, Email, PagerDuty, etc).

Announcing the General Availability of LogDNA Screens

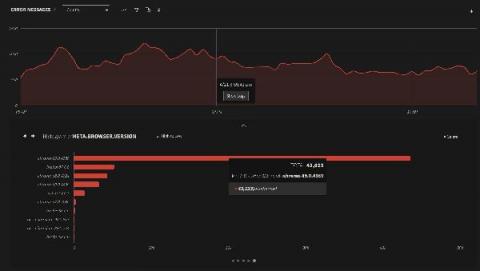
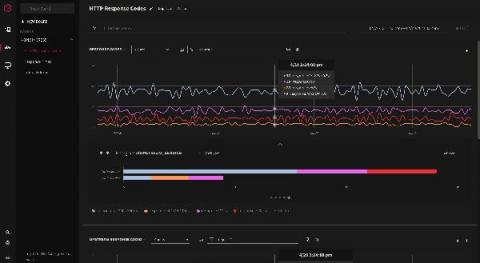
LogDNA is known and loved by developers for our lightning fast live tail and search. With some users ingesting over a petabyte of data per day, our users want to be able to visualize their data and put it to use. You told us what analytics you value most and we’ve taken the first step to providing them within the LogDNA product. The first is having highly interactive graphs. Graphs allow you to analyze patterns and trends by navigating through your data over a period of time.

IBM Expands IBM Cloud Paks Offering with LogDNA

IBM recently announced an expanded Cloud Paks offering with LogDNA. With this offering, developers and engineering teams can easily aggregate and search huge volumes of data from any source to gain real-time insights on their applications. LogDNA is now offered by IBM and deployable on-premise or multi-cloud with all IBM Cloud Paks including Cloud Pak for Applications, Cloud Pak for Data, Cloud Pak for Integration, Cloud Pak for Multi-cloud Management, and Cloud Pak for Automation.

Replicating and Restoring LogDNA Account Configurations

As an engineer who has set up logging for more than one deployment or environment, you know that you usually have one logging account per deployment. You’ve got plenty of pre-created queries, graphs, and alerts set up specific for your company’s use case, all of which are vital to you knowing the health of your infrastructure. Now imagine being responsible for creating and maintaining logging accounts across 10+ deployments.

Screens Beta

Screens display a series of widgets that you can use to share across your organization. Widgets can display your log activity, from the number of logs ingested in the last 4 hours, to a line graph comparing today’s logs to yesterday’s logs. You can control the data you want to display by creating a “Screen” with a combination of different widgets. Post your screen on a company monitor to provide your organization with a snapshot of your system’s activity.

LogDNA and IBM find synergy in cloud

You know what they say: you can’t fix what you can’t find. That’s what makes log management such a critical element in the DevOps process. Logging provides key information for software developers on the lookout for code errors. While working on their third startup in 2013, Chris Nguyen and Lee Liu realized that traditional log management was wholly inadequate for addressing data sprawl in the modern, cloud-native development stack.

IBM Log Analysis with LogDNA

IBM Cloud Log Analysis with LogDNA enables you to quickly find the source of issues and gain deeper insight into application and cloud environment data. IBM Cloud logging begins with log aggregation from application and services within IBM Cloud. IBM partners with LogDNA to bring collection, log tailing and blazing fast log search. LogDNA supports integrations to many cloud-native runtimes and environments.

Managing dynamic data flows across Elasticsearch clusters

Massively scaling free-text search has always been the holy grail in big data. Many software firms now face the burgeoning challenge of searching through previously untapped data sources and the current trend is far surpassing the petabyte scale. Here at LogDNA we manage free-text search for thousands of customers with distinct traffic profiles across a multitude of Elasticsearch clusters.

What Being Named a Forbes 2019 Cloud 100 Rising Star Means to Me

Earlier today, LogDNA was named a Rising Star in connection with the Forbes 2019 Cloud 100 list. The list, which is published annually by Forbes in partnership with Bessemer Venture Partners and Salesforce Ventures, is their assessment of the top 100 private cloud companies in the world. Wow. It’s incredible to write that.

What to do when you lose logs with Kubernetes

Kubernetes has fundamentally changed the way we manage our production environments. The ability to quickly bring up infrastructure on demand is a beautiful thing, but along with it brings some complexity, especially when it comes to logging. Logging is always an important part of maintaining a solid running infrastructure, but even more so with Kubernetes. Because Kubernetes clusters are constantly being spun up, spun down, always in flux, making sure logging functions correctly is critical.