Operations | Monitoring | ITSM | DevOps | Cloud

Mezmo

A Blueprint for Running Stateful Services on Kubernetes

Managing stateful applications has been challenging for engineering and operations teams long before the debut of Kubernetes. In this post, we’ll explore all aspects of your deployments of stateful applications on Kubernetes, from the underlying hardware to Pod update strategies, and provide insights into how LogDNA uses stateful Kubernetes to build one of the world’s fastest log management platforms.

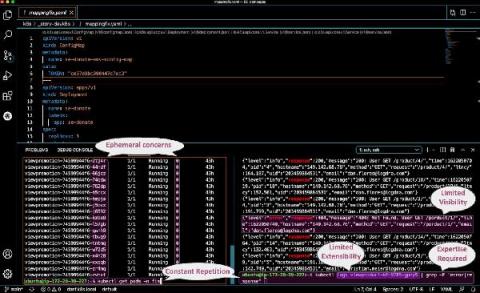
How Volatility Impacts Visibility

If you’re like me, you’re working from home, social distancing, and staying safe during these unprecedented times. I spend a lot of time thinking about how this will impact the way we will work in the future. Going through this with our teams creates stronger bonds as we learn how to work remotely and through a global pandemic. We now spend more time in zoom meetings and use more collaborative tools than we did even just a month ago.

LogDNA Wins 2020 IBM Cloud Embed Excellence Award

We are so excited to announce that LogDNA received the IBM Cloud Embed Excellence Award during the ​IBM Think​ conference on May 5, 2020. IBM Cloud’s Data & AI Excellence Awards recognize the stellar performance of IBM Business Partners who drive extraordinary client experiences and business growth. IBM Log Analysis with LogDNA and IBM Cloud Activity Tracker with LogDNA are built on IKS and are deeply integrated with IBM Cloud.

Introducing the New LogDNA Agent for Kubernetes

On the internet, nothing necessarily stays easy, simple, and reliable forever – but we’re trying to keep it that way for your logs. When our customers use Kubernetes, they want to remain focused on the real challenges of scaling, and avoid infrastructure headaches, so that they can adapt to the unexpected easily and with a minimum of toil. That’s why we continue to invest in the LogDNA Agent. It’s built to handle file logging in even the most intensive Kubernetes deployments.

Store and Show Raw Log Lines

LogDNA is adding the ability to store and view raw lines, allowing customers to debug with logs in their unaltered form. If you’ve ever looked at your logs and noticed that the timestamp was different than what you expected, it is usually due to a long latency between the event and processing time of the logs. Depending on the size of the latency, we may update the log timestamp to order them accurately and to provide a cleaner and more intuitive search experience.

Announcing the General Availability of Extract and Aggregate fields

The Extract and Aggregate fields feature allows users to custom parse historical logs (post ingestion) and get an aggregated count on those newly parsed fields. Enterprise SREs work with large systems that consist of internally built components and external products. Debugging with logs from external products can be extremely challenging.

Introducing Agent v2 beta for Kubernetes

In the olden days, we used to have to get logs by putting our agent on one machine at a time, like hitching a horse to a horse-drawn carriage. But now, we’ve got Kubernetes. It’s like a horse factory, and we’ve got more horses than we know what to do with. In this wild west of containerization, we could quickly end up underneath more logs than our old-timey agent could keep track of! But now there’s a new sheriff in town.

S3 Bucket Lambda Function

AWS has a lot of services, and they all generate logs. A lot of logs. We’ve worked hard to make sure you can capture logs from every source and service on AWS, and today we’re happy to announce the final piece of our AWS logging puzzle: LogDNA’s S3 Collector integration. It’s an easy-to-use Lambda function that lets you ingest any AWS logs that get dumped to S3 – like logs from CloudFront and ELB.

Weekly and Monthly Alert Insights

SRE and Security teams rely heavily on alerts to know whether their systems are experiencing issues and to prevent any future outages. At LogDNA, customers can set alerts that trigger when specific logs match (presence alerts) or set an alert to go off if there are expected lines that haven’t come through (absence alerts). These alerts can be set up with various channels so you can be alerted in the product of your choice (Slack, Email, PagerDuty, etc).