Operations | Monitoring | ITSM | DevOps | Cloud

Mezmo

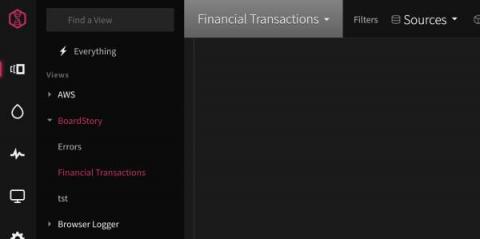
Introducing Browser Logger - Unlocking the Power of Frontend Logs

Modern web applications are more reliant on the frontend than ever before. While there are many benefits to this approach, one downside is that developers can lose visibility into issues when things go wrong. When the application experience is degraded, engineers are left waiting for users to report issues and share browser logs. Otherwise, they might be left in the dark and unaware that any issues exist in the first place.

How to Improve Kubernetes Management and Administration with LogDNA

In this video, we will show how LogDNA helps DevOps teams using Kubernetes to consume, control and collaborate with logs. By providing value to data from every source, including Kubernetes, developers are empowered to leverage logs to ensure they can continue to accelerate development cycles, and Ops teams can easily onboard microservices teams without the need to modify their infrastructure.

Export API v2 - Streamline Large Log Data Exports

The LogDNA platform improves how teams use logs to help with debugging and troubleshooting. However, having fast access to actionable data isn’t the only value you can get from logs. There’s a lot of additional value in analyzing historical log data to understand long term trends. For example, customers can use log data as a way to represent audit events for user actions and benefit from visualizing them in a 3rd party software.

NGINX Ingress Controller Template

We set out with a plan this year to nurture and grow our developer ecosystem. In 2020, we launched our Template Library to empower joint users of LogDNA and our partners to have an out-of-the-box logging experience from every layer of their stack. As the use of these templates has grown, users have told us that they save them time from manually creating Views, Boards, and Screens, and helps them gain insight from their logs much quicker.

Tutorial | How to Set Up LogDNA Ingestion Source

Centralize your logs from any source in LogDNA so that you can monitor and troubleshoot your systems and applications in a single UI. In this video, I’ll show you how to add an ingestion source. We support multiple ingestion sources, which you can learn about in our documentation portal below. In this video, we’ll show you how to ingest Kubernetes logs using the LogDNA Agent.

Tutorial | How to Custom Parsing with LogDNA

LogDNA automatically parses common log types so that you can easily view and search through them. If you have logs that aren't in a format we automatically parse, you can create a custom parsing template so they'll be parsed as well, allowing you to use them in views, alerts, boards, and graphs. In this video, we will show you how to use Custom Parsing templates for a log that we don't automatically parse, such as one from an internal application.

Tutorial | How to use LogDNA Screens

Use LogDNA Screens to display daily log activity from all of your systems or select systems. Use time-shifted graphs to aggregate data from the previous week to compare activity levels in your current week. Our screens let you create an easy-to-read dashboard containing widgets that convey metrics from your logs. These include graphs, gauges, tables, and time-shifted graphs. In this video, we'll create a screen with widgets that provide different views of your webserver's 404s.

Control Your Logging Spend With Usage Quotas

We built LogDNA around the idea that developers are more productive when they have access to all of the logs they need, when they need them. However, we also know that log management can get expensive fast. And, for anyone who owns the budget for developer tools, logs can be an unpredictable line item as you try to determine your monthly, quarterly or even annual spend.