Operations | Monitoring | ITSM | DevOps | Cloud

Percepio

How DevAlert Can Boost Your Embedded Software Development

Percepio DevAlert is a powerful observability solution for embedded software developers providing alerts on anomalies in your software, such as errors, crashes, and cybersecurity warnings. The alerts provide deep observability into the device software behavior for diagnosing the issues, such as core dumps, software traces, logs and any other device data you choose to include. There are several use-cases for this kind of observability.

How To Use AUTOSAR Runnables With Tracealyzer

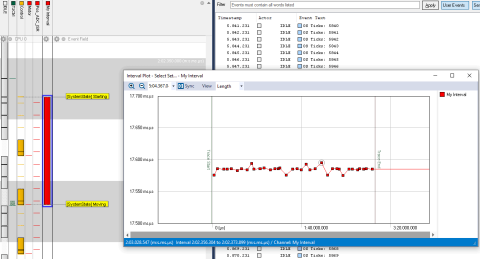
Tracing of “runnables” is a fairly new feature in Percepio Tracealyzer, added in v4.7.0. One of our automotive customers needed this feature to make ISO 26262 certification of their Electronic Control Unit (ECU) software easier. In order to properly allocate ECU functions to tasks and to cores, and to ensure that they meet the budgeted resources, it is useful to know execution times, response times and wait times for each task and runnable.

Tracealyzer 4.8.2 Is Out

Tracealyzer version 4.8.2 has just been released. This version mainly fixes bugs, such as custom state machine models not being remembered on trace reload, and eliminates a number of compiler warnings in the Recorder source code. In addition, the update features improved streaming over UDP, and the bundled SSH library SSH.NET has been updated to the latest version. Users with a current maintenance contract can upgrade to Tracealyzer 4.8.2 from within the application, or by visiting the update page.

DevAlert 2.0 Now Available

DevAlert 2.0, which is now immediately available from Percepio, is a major upgrade to our edge observability platform. The upgrade provides much improved diagnostic capabilities, including core dumps for Arm Cortex-M devices. This allows remote inspection of crashes, errors or security anomalies in full detail, including the function call stack, parameters and variables and with source code display.

Does Tracealyzer fit into my project?

Every developer wants universally applicable tools for their embedded development. However, hardware (processor type) and software (RTOS) architecture can limit the choice, making it a decision for the second-best rather than the best tool – even if you are in the mainstream. This is one of the reasons why Software Development Kits (SDKs) are becoming increasingly popular – even more so if they are easy to use and deploy.

PX5 Announces Tracealyzer Support for PX5 RTOS

A little more than a month ago, we released the free Tracealyzer SDK – a toolkit that allows other embedded software vendors to integrate Tracealyzer recording in their own software. At that time, the development team at PX5 in California were already hard at work combining Tracealyzer with their PX5 RTOS, and yesterday they released the integration. Built with Percepio’s SDK, in a just a few weeks.

Partner Watch: CI/CD Build Systems for Embedded Development

To excel in embedded development in 2023, it is essential to have a solid understanding of build systems, continuous integration, and deployment strategies. This workshop by Percepio training partner Jacob Beningo aims to provide a comprehensive primer on these practices, equipping participants with the knowledge and skills necessary to tackle complex firmware projects with confidence.

Introducing Tracealyzer SDK for Custom Integrations

Percepio Tracealyzer is available for many popular real-time operating systems (RTOS), including FreeRTOS, Zephyr, and Azure RTOS ThreadX, and also for Linux. But what if you want to use it for another RTOS, one that Percepio doesn’t provide an integration for? Then you’ve been out of luck—until now.

The Microscope for Embedded Code: How Tracealyzer Revealed Our Bug

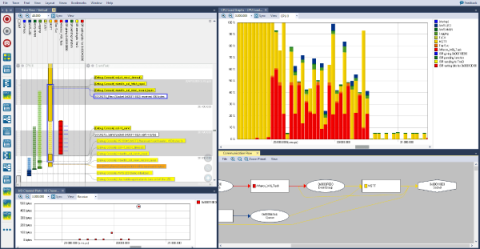
Tracealyzer. You can’t stay in the wonderful world of debugging and profiling code without hearing the name. If you look at Percepio’s website, it is compared to the oscilloscopes of embedded code. Use it to peek deep inside your code and see what it does. Of course, the code receives an interrupt and checks a CRC before sending the data through SPI, but how does it do it? And how long does it take?