Operations | Monitoring | ITSM | DevOps | Cloud

Splunk

Why Does Observability Need OTel?

To successfully observe modern digital platforms, a new data collection approach was needed. And OpenTelemetry (OTel) was the answer - an industry-agreed open standard - not a single vendor's approach - on how observability (O11y) data should be collected from a platform. This separates out data collection from the vendors’ platform of data processing and visualisation, making the data collecting approach vendor agnostic.

Predictive vs. Prescriptive Analytics: What's The Difference?

Imagine being able to foresee future trends, anticipate customer behaviour, optimize your operations, and take actions that are not just reactive — they shape the future of the market. In the world of data-driven decision-making, we're able to do all that by paying attention to the information we analyze from predictive and prescriptive analytics. A large and growing field, data analytics is often broken into four categories — of which predictive and prescriptive are two!

Announcing Splunk Federated Search for Amazon S3 Now Generally Available in Splunk Cloud Platform

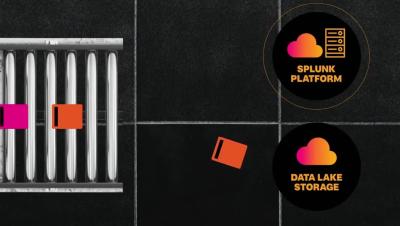
Splunk is pleased to announce the general availability of Federated Search for Amazon S3, a new capability that allows customers to search data from their Amazon S3 buckets directly from Splunk Cloud Platform without the need to ingest it. Enterprises rely heavily on cloud object storage services as the de facto destination for their new data to leverage the cost, compliance, security, scalability and manageability benefits that cloud platforms can offer.

APM Today: Application Performance Monitoring Explained

Application Performance Monitoring (APM) is a technology approach that provides real-time information about how your software applications are performing. With a comprehensive view into application health and availability, APM can do things like: Both the importance and the usage of APM has grown in recent years. That’s because companies rely on increasingly complex applications to run their businesses. Here is what you need to know about Application Performance Monitoring.

What is DataOps? Process, Benefits & Best Practices Today

Whether you're a small business or a large enterprise, working with data consumes time and effort. But what if there was a way to turn this data into opportunities for growth? That’s what DataOps offers. DataOps helps create a collaborative environment to improve data quality by automating manual processes. Research shows the market for DataOps platforms will grow from USD 3.9 billion in 2023 to USD 10.9 billion by 2028. This growth shows how steadily organizations will streamline their operations.

Infrastructure Monitoring Today: How It Works & What It Does

The famous phrase “Houston, we’ve had a problem” isn’t a one off event for space missions or Tom Hanks — its a regular occurrence for most IT teams! Today’s IT teams are peppered with alerts indicating that something has gone amiss in their production environments. Visibility of uptime and performance is an essential part of ensuring that your IT infrastructure can power applications to meet business needs and deliver value for users.

Know Your Customer Again Revisited

At the end of last year, I wrote about using Splunk to monitor the Know Your Customer (KYC) use case that is a regulation in most Financial Services Institutions in many countries. The last part of the regulation states that continuous monitoring of your customers in terms of their interactions and transactions needs to take place.

Revolutionize Data Ingestion: Introducing Terraform Support for Splunk Cloud Platform

Splunk Cloud Platform has always been a powerful platform for aggregating, analyzing, and extracting actionable insights from your machine-generated data. As data volumes continue to grow exponentially, efficiently managing the ingestion of data into Splunk becomes crucial. To address this need, we are thrilled to announce the debut of Terraform support for the Splunk Cloud Platform.

The Synthetic Monitoring Beginner's Guide

Synthetic monitoring is one holistic technique within the wide world of IT monitoring and application performance monitoring (APM) and it’s focused on web performance. Synthetic monitoring emulates the transaction paths between a client and application server and monitors what happens. The goal of synthetic monitoring is to understand how a real user might experience an app or website. In this article, let’s go deep with this topic.

Modeling and Unifying DevOps Data Part 2: Code

How do you come to grips with all of the code engineers are committing, pushing, merging, and deploying within your organization? Have you started even looking at that data? If not, you’re missing out on a crucial source of productivity, security, and Software Development Life Cycle (SDLC) data. But how can you get a handle on all of that code-related activity?