Operations | Monitoring | ITSM | DevOps | Cloud
Code, Coffee, and Unity: How a Unified Approach to Observability and Security Empowers ITOps and Engineering Teams
In today's fast-paced and ever-changing digital landscape, maintaining digital resilience has become a critical aspect of business success. It is no longer just a technical challenge but a crucial business imperative. But when observability teams work in their own silos with tools, processes, and policies, disconnected from the security teams, it becomes more challenging for companies to achieve digital resilience.
IT Orchestration vs. Automation: What's the Difference?
As modern IT systems grow more elaborate, encompassing hardware and software across hybrid environments, the prospect of managing these systems often grows beyond the capacity an IT team can handle. Automation is one great way to help. But it's important to know that not all automation is the same — chatbots are probably not the solution your team is looking for to handle these incredibly complex systems.
Developing the Splunk App for Anomaly Detection
Anomaly detection is one of the most common problems that Splunk users are interested in solving via machine learning. This is highly intuitive, as one of the main reasons our Splunk customers are ingesting, indexing, and searching their systems’ logs and metrics is to find problems in their systems, either before, during, or after the problem takes place. In particular, one of the types of anomaly detection that our customers are interested in is time series anomaly detection.
What Is ITOPs? IT Operations Defined
IT operations, or ITOps, refers to the processes and services administered by an organization's IT staff to its internal or external clients. Every organization that uses computers has a way of meeting the IT needs of their employees or clients, whether or not they call it ITOps. In a typical enterprise environment, however, ITOps is a distinct group within the IT department. The IT operations team plays a critical role in accomplishing business goals.
Introducing the Splunk App for Behavioral Profiling
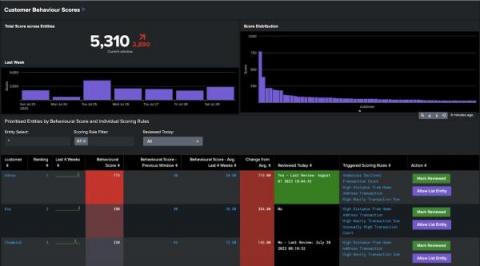
Splunk is the platform for a million use cases, used to investigate operational data across security, observability, fraud, business intelligence and many other domains. But, in my time at Splunk, I’ve come to realize that all of our customers face challenges that stem from the same core problem: Within exploding data volumes, finding the anomalously behaving entities that are most threatening to the resilience of their organization.
Unveiling Splunk UBA 5.3: Power and Precision in One Package
In the face of an ever-evolving cybersecurity landscape, Splunk never rests. Today, we're ecstatic to share the release of Splunk User Behavior Analytics (UBA) 5.3, delivering power and precision in one package, and pushing the boundaries of what's possible in user and entity behavior analytics.
Performance Testing: Types, Tools & Best Practices
To maximize the performance and value of your software apps, networks and systems, it’s critical to eliminate performance bottlenecks. Performance testing has become critical in every organization to reveal and fix performance bottlenecks, ensuring the best experience to end users. This article explains what performance testing is, its importance, and the various types of performance testing.
Cloud Analytics 101: Uses, Benefits and Platforms
Cloud analytics is the process of storing and analyzing data in the cloud and using it to extract actionable business insights. Simply one shade of data analytics, cloud analytics algorithms are applied to large data collections to identify patterns, predict future outcomes and produce other information useful to business decision-makers.
From Disruptions to Resilience: The Role of Splunk Observability in Business Continuity
In today's market, companies undergoing digital transformation require secure and reliable systems to meet customer demands, handle macroeconomic uncertainty and navigate new disruptions. Digital resilience is key to providing an uninterrupted customer experience and adapting to new operating models. Companies that prioritize digital resilience can proactively prevent major issues, absorb shocks to digital systems and accelerate transformations.


