Operations | Monitoring | ITSM | DevOps | Cloud
Data Pipelines: How Data Pipelines Work & How To Get Started
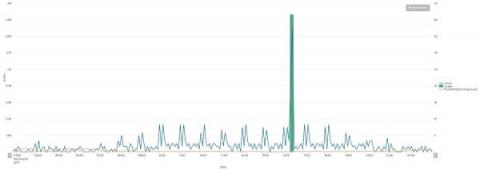
Every millisecond, humans generate significant volumes of data, from various IoT devices such as our wearable devices to daily activities such as internet surfing and tracking our workouts. Data continues to accumulate. Statista estimates that by 2025, the amount of data will have increased to 180 zettabytes. That's far too much information.
A Deeper Dive into Machine Learning at Splunk
A typical bit of feedback I have had during my time at Splunk is that the Splunk Machine Learning Toolkit (MLTK) looks nice and all, but how are we supposed to get started using it? Choosing the right technique, let alone the right algorithm can be a daunting task for those who are unfamiliar with machine learning (ML). We’ve been thinking long and hard about how we can help offer more prescriptive introductions into using ML at Splunk and I’m pleased to present our set of MLTK deep dives.
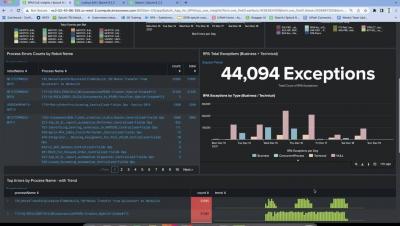
UiPath Robotic Process Monitoring for Splunk - Demo Walkthrough
Why You Need Synthetic Monitoring
Synthetic monitoring can be one of the most powerful tools in your DevOps team’s toolkit, especially for the SRE, yet is one that is often overlooked by people building out a reliability mindset. Synthetic monitoring permits you to simulate any transaction or interaction users can have in your website or app, from places around the world, as often as you’d like.
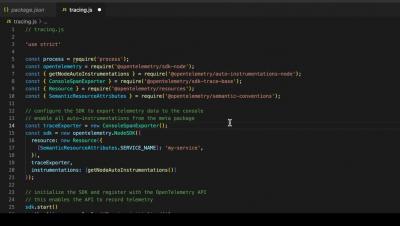
OTEL Me More: A quick start guide to OpenTelemetry-JS and Express
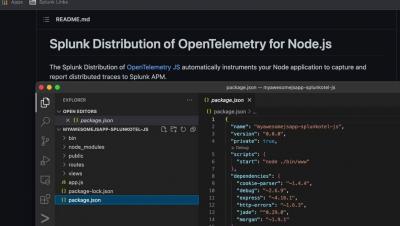
OTEL Me More: Splunk-OTEL-JS and Express emitting to an OTEL Collector
Incident Severity Levels 1-5 Explained
The question isn't whether an incident will happen: it's when it will happen. Systems will crash. Software will fail. Vendors will suffer an outage of their own. It's your job to be prepared for these problems, and incident severity levels are one of the tools you need. Incidents have varying impacts on your business and customers. Incident severity levels are how you classify their impact and manage your response.
Dashboard Studio: It's the Little Things
It's always interesting to hear what feature requests dashboard users share with our product team. Sometimes it's big things — such as being able to set tokens on drilldowns — and sometimes it's little things. In Splunk Cloud Platform 9.0.2208, we've included a handful of Dashboard Studio "little things" updates.
Welcome to Splunk Secure Gateway 3.0
Splunk Mobile puts the power of Splunk in your hands. But with great power, comes great responsibility. That’s why this year with the release of Splunk Enterprise 9.0, we’ve shipped Splunk Secure Gateway (the backend service that powers Splunk Mobile) with even more features and tools to help you responsibly manage your mobile fleet.


