Operations | Monitoring | ITSM | DevOps | Cloud

Splunk

Splunk SOAR Feature Video: Contextual Action Launch

Splunk SOAR apps have a parameter for action inputs and outputs called "contains". These are used to enable contextual actions in the Splunk SOAR user interface. A common example is the contains type "ip". This is a powerful feature that the platform provides, as it allows the user to chain the output of one action as input to another.

Onboarding Data in Splunk Security Analytics for AWS

Splunk Security Analytics for AWS’ new data onboarding wizard quickly takes you from subscribing to the service to visualizing your AWS environment. We’ll walk through the wizard in this video, and you’ll see how the new process can save you hours, days or even weeks when compared to traditional data onboarding processes.

With Splunk Synthetic Monitoring, proactively find and fix your user experience issues

Trend, visualize, and improve performance of all your page resources and third party dependencies. Detect and resolve issues faster across your critical user flows, business transactions and API endpoints using Splunk Synthetic Monitoring.

Get Started with Splunk for Security: Splunk Security Essentials

Continuing to ride the waves of Summer of Security and the launch of Splunk Security Cloud, Splunk Security Essentials is now part of the Splunk security portfolio and fully supported with an active Splunk Cloud or Splunk Enterprise license. No matter how you choose to deploy Splunk, you can apply prescriptive guidance and deploy pre-built detections from Splunk Security Essentials to Splunk Enterprise, Splunk Cloud Platform, Splunk SIEM and Splunk SOAR solutions.

Prioritize and resolve performance defects with Splunk Web Optimization

Find, fix and prevent web performance issues with an intelligent optimization engine. From Google's Lighthouse scores to core web vitals and 50+ modern performance metrics, learn to benchmark and improve page performance and user-experience with Splunk Web Optimization. Get a free trial as part of Splunk Synthetic Monitoring today.

Detect any issue with Splunk APM before it turns into a customer problem

With 100% of spans and traces captured, Splunk APM meets any necessary business KPI’s and SLO metrics while investigating and troubleshooting transaction errors related to a backend application. Easily construct error budgets that measure performance of services today - learn how with this free trial Splunk Observability Cloud.

Deep Learning Toolkit 3.6 - Automated Machine Learning, Random Cut Forests, Time Series Decomposition, and Sentiment Analysis

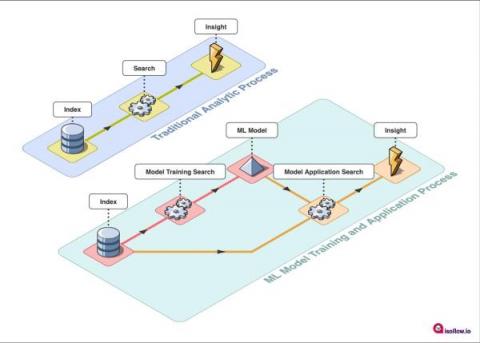
We’re excited to share that the Deep Learning Toolkit App for Splunk (DLTK) is now available in version 3.6 for Splunk Enterprise and Splunk Cloud. The latest release includes: Let’s get started with the new operational overview dashboard which was built using Splunk’s brand new dashboard studio functionality which I highly recommend checking out. You can learn more about it in this recent tech talk which you can watch on demand.

Dissecting DevOps - Code-to-Cloud Visibility: The Framework for DevOps Success

Recording from the DevOps.com webinar Code-To-Cloud Visibility where Splunker Chris Riley covers the key concepts to maintain visibility from the point a feature is defined to the point that feature runs in production. Learn about the practices of DevSecOps, Pipeline Analytics, and Observability. And why a Code-To-Cloud strategy is necessary to support and accelerate Cloud and DevOps transformation.