Operations | Monitoring | ITSM | DevOps | Cloud

Stackify

The Business Case for OpenTelemetry - APM for Modern Applications

DevOps professionals know that ensuring optimal application performance is paramount. More and more customers and prospects interact with companies online, and any hiccup can impact your bottom line. What’s more, companies continue to leverage cloud-native apps for improved flexibility and resource optimization. All of which means that Application Performance Monitoring (APM) tools need to evolve.

Getting Started With Azure Serverless

Serverless computing represents a paradigm shift in how we build, deploy and scale cloud applications. By decoupling infrastructure and server management from code development, developers are free to put a single focus on fine-tuning code in app development. The era of serverless computing puts innovation at center stage and removes the traditional constraints of server management.

Self Hosted Retrace - For your Data Governance, Centralised Control needs

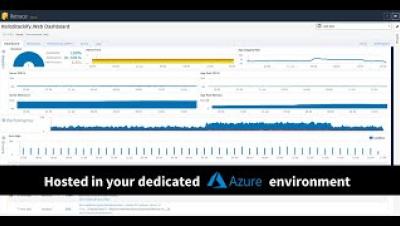
Our customers can now get a self hosted Retrace, where their own data will never leave the Azure cloud environment. Stackify by Netreo will deploy and manage the Retrace platform that includes infrastructure components and software. Customer will get the access to the Retrace within their corporate domain, rather than public internet.

OTel Applications on Retrace

We are excited to inform you that Open Telemetry is now available for you with the introduction of “Netreo OTel Appliance”. With the OTel Appliance, cloud-native services like AWS Lambda, AWS ECS, AWS EKS, Azure Functions, Azure App Services, Azure Container Instances, and Azure Kubernetes Services can be monitored and you see application traces and logs in Retrace UI (s1.stackify.com). The applications hosted in the cloud Serverless and containers can be monitored without running the Retrace agent within the instance itself.

A Basic Introduction to OpenTelemetry Python

Think of a tool that simplifies application monitoring and helps developers and staff trace, collect logs and measure performance metrics. That is what OpenTelemetry Python provides. OpenTelemetry (OTel) Python acts as a guiding light, offering insights into the behaviors and interactions of complex, distributed systems and enabling a deeper understanding of performance bottlenecks and system dependencies. The significance of OTel lies in its pivotal role in modern software development.

An Introduction to OpenTelemetry JavaScript

Monitoring and observing application performance is a cornerstone for maintaining robust and efficient systems in the ever-evolving development landscape. One key player in this domain is OpenTelemetry. This post provides a comprehensive tutorial and unpacks what OpenTelemetry is, its applications and integration into the JavaScript ecosystem.

ML and APM: The Role of Machine Learning in Full Lifecycle Application Performance Monitoring

The advent of Machine Learning (ML) has unlocked new possibilities in various domains, including full lifecycle Application Performance Monitoring (APM). Maintaining peak performance and seamless user experiences poses significant challenges with the diversity of modern applications. So where and how does ML and APM fit together? Traditional monitoring methods are often reactive, resolving concerns after the process already affected the application’s performance.

Retrace Keynote: Observability (metrics, traces, logs) - Take back control of your data

In the keynote recorded during our recent user group session NUGGETS 2023, Sanjeev Mittal, GM of Retrace talks about how organizations are rapidly moving their infrastructure to the cloud and how their costs and complexity are increasing. Our customers are looking for Observability solutions that give them control of data and costs.