Operations | Monitoring | ITSM | DevOps | Cloud

Grafana

GrafanaCONline Day 2 recap: Grafana 8 deep dive, Prometheus innovation, a billion time series at Robinhood, and more

GrafanaCONline 2021 is off to a great start! Tune in live (for free!) or sign up to get notified about on-demand access to all the session recordings, which will be available after GrafanaCONline ends. If you didn’t get a chance to watch yesterday’s presentations, here’s what you missed on Day 2 of the conference.

Grafana Tempo is now GA with the release of v1.0

It’s exciting to see a project that you’ve poured so much time into progress at the rate Tempo has. Tempo is not the first piece of software I have shepherded from the very first line of code to a production release, but it is the first large-scale open source project I have led. Working with a community that is able to use and improve your software as a community is a powerful thing.

GrafanaCONline Day 1 recap: Grafana 8, Tempo GA, machine learning, ISS, and more!

GrafanaCONline 2021 is live! Join us over the next two weeks for more than 30 virtual sessions, ranging from demos of the new Grafana 8.0 release and technical deep dives around Grafana, Prometheus, Loki, and Tempo to insider looks at how companies are leveraging Grafana in observability, IoT, science, and business intelligence. GrafanaCONline 2021 runs through June 17.

GrafanaCONline 2021: Your guide to the newest announcements from Grafana Labs

In addition to all the great talks from community members about their use cases, GrafanaCONline 2021 will include a number of sessions with the Grafana team about the latest features and use cases for Grafana. Throughout the week, we’ll continue to unveil new features, go deeper with live demos, and share our plans about the future of Grafana.

Visualize Humio logs alongside your other data sources in Grafana Cloud with the new plugin for Grafana

Being able to get the big picture and immediately pivot between siloed data is one of the key values Grafana Cloud provides. Our composable observability platform integrates Prometheus and Graphite metrics, Loki logs, and Tempo traces with Grafana — and also allows you to draw data in from other sources of your choice concurrently.

Monitor and alert on essential RabbitMQ cluster metrics with the new Grafana Cloud integration

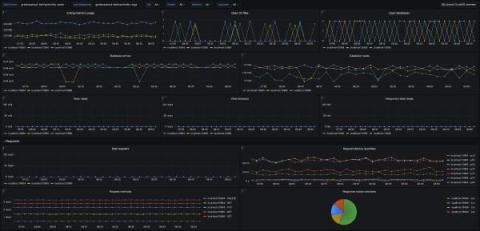
We are happy to announce that the RabbitMQ integration is available for Grafana Cloud, our composable observability platform bringing together metrics, logs, and traces with Grafana. RabbitMQ is one of the most popular open source message brokers, used worldwide at both small startups and large enterprises. It is easy to deploy on premises and in the cloud, and supports multiple messaging protocols.

How to alert on high cardinality data with Grafana Loki

Amnon is a Software Engineer at ScyllaDB. Amnon has 15 years of experience in software development of large-scale systems. Previously he worked at Convergin, which was acquired by Oracle. Amnon holds a BA and MSc in Computer Science from the Technion-Machon Technologi Le' Israel and an MBA from Tel Aviv University. Many products that report internal metrics live in the gap between reporting too little and reporting too much.

Turn your home office into a NOC room with Philips Hue and Grafana

I recently got a couple of Philips Hue Play lights to spice up my home office setup, and after a bit of tinkering with the APIs, I decided it would be a fun project to create my own personal NOC room, using them to visualize the status of some system I’m monitoring.