Grafana v6.5 Released
The Grafana 6.5 stable release includes improvements to CloudWatch, Explore, Templating, Azure Monitor, Graphite, Docker, Provisioning, Auth Proxy, OAuth, and much more.


The Grafana 6.5 stable release includes improvements to CloudWatch, Explore, Templating, Azure Monitor, Graphite, Docker, Provisioning, Auth Proxy, OAuth, and much more.
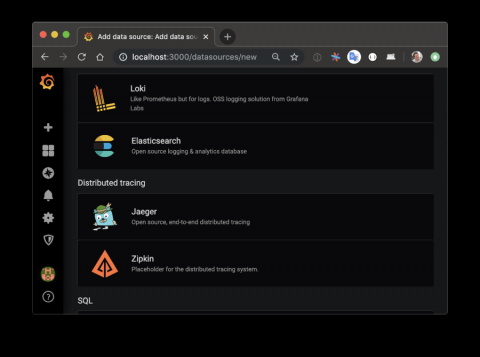
At the Grafana Labs booth at KubeCon + CloudNativeCon in San Diego this week, we showed a demo of a future feature for Grafana: distributed tracing datasources. Until now, Grafana has been bringing together metrics and logs, to be viewed side-by-side on one screen. Now we’re adding tracing, which has been a missing puzzle piece for even more observability in Grafana.
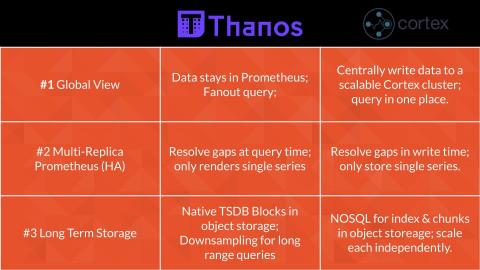
This blog post is a writeup of the presentation Bartek Plotka and I gave at PromCon 2019. Cortex is a horizontally scalable, clustered Prometheus implementation aimed at giving users a global view of all their Prometheus metrics in one place, and providing long term storage for those metrics. Thanos is newer project aimed at solving the same challenges. In this blog post, we compare these two projects and see how it is possible to have two completely different approaches to the same problems.
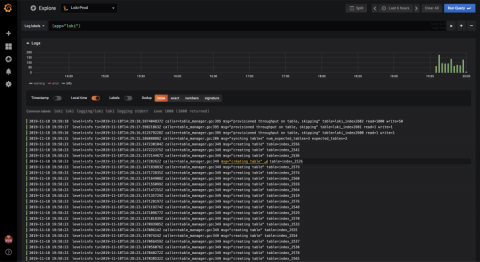
Today is an exciting day for Loki, as we have decided it’s time for Loki to graduate out of beta and into a 1.0.0 GA release! It’s been just about a year since we announced Loki at KubeCon + CloudNativeCon North America in Seattle, and in that time over 137 contributors have made more than 1,000 contributions. Here’s a look at where the project is today.
Paytm Insider’s motto is “to make every day less everyday,” says Hitesh Pachpor, Technical Manager for the popular platform for buying event tickets in India.
In my role at Grafana Labs, I speak with a lot of engineers who feel the pain of their organizations’ lack of consolidated observability – so much so they set out to solve the problem themselves. Often, that search leads to Grafana, and after a quick exploration of what an enterprise feature or cloud solution can provide, they’ll get in touch. We work with them on data collection and help them start a trial.
PromCon was held in Munich again this year, and this year was the best. I had a great time meeting lots of old friends and interacting with the amazing Prometheus community. I want to give a big shout out to Richi H for organizing the conference, and to everyone who attended for being an amazing audience! This year Grafana Labs carbon offset travel and food for the conference – but this post is not about that. Grafanistas gave 4 talks in the main track and another 6 lightning talks.
Building dashboards that show real-time streaming data and allow for interactive queries is challenging. At the recent InfluxDays conference in San Francisco, Ryan McKinley, Grafana Labs VP of Applications, discussed new approaches to integrate real-time data into Grafana dashboards. Prior to joining Grafana, McKinley worked at a renewable energy startup, Natel Energy, which builds hydropower turbines. There, he used Grafana and Influx to display an overview of how the systems were working.