Operations | Monitoring | ITSM | DevOps | Cloud
InfluxData
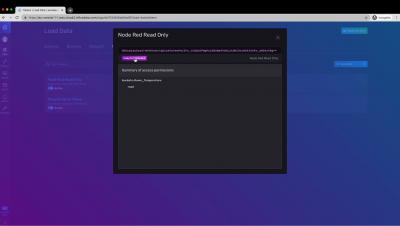
How to Take Data Stored in InfluxDB Cloud 2 and Use It in a "Switch" Node within Node-Red
How InfluxDB Works with IoT Data
Over the past few years, the IoT community has embraced InfluxDB as a cornerstone of the solutions they build. Whether modernizing or greenfield, InfluxDB has helped many in working with vast quantities of sensor and device data as we continue to deliver on our promise of time to awesome for IoT.
Resource Roundup: Getting Started with InfluxDB Cloud on Google Cloud
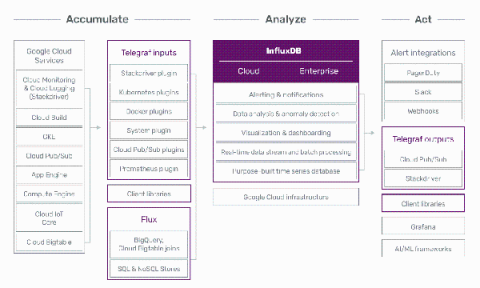
Are you looking to get started with InfluxDB on Google Cloud? We’ve pulled together our top resources to help you get the most out of your time series data whether that’s coming from your Google Cloud infrastructure or your own application. Read how customers like Wayfair and Vera C. Rubin Observatory use InfluxDB on Google Cloud to solve their time series data collection and processing challenges to power their multifaceted, complex real-world use cases.
Learn about InfluxDB Cloud
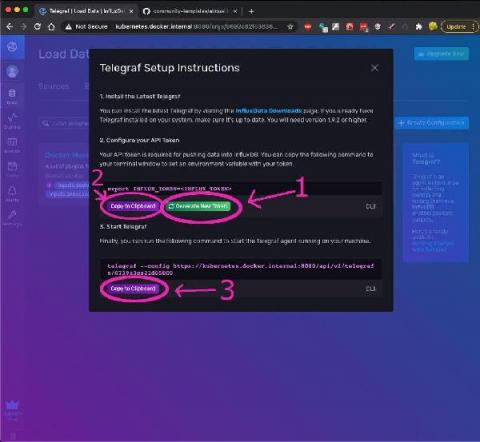
New in Telegraf 1.18.0: Beat, Directory, NFS, XML, Sensu, SignalFX and More!
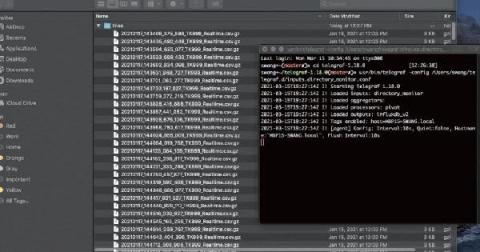
Last week we released Telegraf 1.18 with a range of new plugins including Elastic Beats, directory monitoring, NFS, XML parsing and some aggregators and processors to help with your data ingestion. All of these packages were written in Go 1.16.2. This was one of our largest releases in a while and couldn’t have been done without the 70+ Telegraf community members who contributed to writing plugins, fixing bugs, reviewing code, and everything else to improve Telegraf!
Introduction to Giraffe
Giraffe is InfluxData’s graphing library, built to use and graph the data coming from InfluxData’s time series database, InfluxDB. Yes, there are other graphing libraries available; but ours is the only one purpose-built to graph line protocol without having to convert it. Plus, we have lots of great features, like legends and colorization, without much configuration. So, how to get started?
How to Build a Monitoring Application in Less Than 10 Minutes
Getting Started with Time Series Data Science
Are you interested in performing time series forecasting or anomaly detection, but you don’t know where to start? If so, you’re not alone. There is an overwhelming variety of libraries, algorithms, and workflow recommendations for these tasks. As a Developer Advocate at InfluxDB, the leading time series database, I’ve researched time series data science methodologies and best practices for forecasting and anomaly detection.
TL;DR InfluxDB Tech Tips: Debugging and Monitoring Tasks with InfluxDB
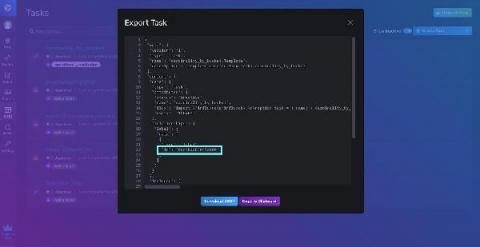
With InfluxDB you can use Tasks to process data on a schedule. You can also use tasks to write custom alerts. However, sometimes your task will fail. In this TLDR, we’ll learn how to debug your task with the InfluxDB UI and the InfluxDB CLI.


