Operations | Monitoring | ITSM | DevOps | Cloud

October 2022

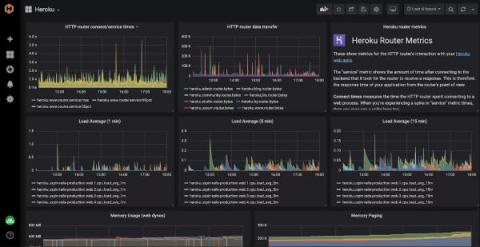
Installing the Hosted Graphite Heroku Monitoring & Dashboards Add-on.

HostedGraphite provides a complete infrastructure and application monitoring platform from a suite of open-source monitoring tools. Use Hosted Graphite and view all required metrics on beautiful dashboards in real time. Hosted Graphite offers a wide range of tools, add-ons, and plugins which make it possible to measure, analyze, and visualize large amounts of data about your applications with ease.

Top 10 cAdvisor Metrics for Prometheus

cAdvisor (container advisor) is an open-source container-monitoring platform developed and maintained by Google. It runs as a background daemon process for collecting, processing, and aggregating data into performance characteristics, resource usage statistics, and related information about running containers. With built-in support for Docker and literally any other container type out of the box, cAdvisor can be used to collect data on virtually any type of running container.

Monitoring your Network SNMP devices using Hosted Graphite

When you design architecture to monitor your digital assets - either software applications or hardware devices, you need to use different strategies depending on your monitoring target. The factors you want to consider can vary including methods of retrieving monitoring data, frequency of data collection, and how you want to surface metrics and insight you find to stakeholders. In this article, we will mainly discuss how we can monitor your network SNMP devices using Hosted Graphite.

How to monitor the impact of Puppet Runs using Hosted Graphite

In this article, we will look at what Puppet is and why it is important to monitor Puppet server metrics. We will also analyze the tools that help us monitor Puppet’s performance. Ultimately we will learn about the benefits of using Hosted Graphite by MetricFire to monitor Puppet server metrics. Sign up for MetricFire free trial today or book a demo with the MetricFire team to understand how you can take advantage of its monitoring solutions.

Monitoring Kubernetes with Hosted Graphite by MetricFire

In this article, we will be looking into Kubernetes monitoring with Graphite and Grafana. Specifically, we will look at how your whole Kubernetes set-up can be centrally monitored through Hosted Graphite and Hosted Grafana dashboards. This will allow Kubernetes Administrators to centrally manage all of their Kubernetes clusters without setting up any additional infrastructure for monitoring.

Security Best Practices at MetricFire

At MetricFire, we treat your data as our data, and we secure our data. Security is prioritized at every level of our infrastructure so you can have peace of mind that your data is sent and stored safely. Keeping MetricFire secure is fundamental to the nature of our business. One of our key priorities is to secure our customers’ metrics and trust. We diligently ensure that we comply with industry security standards so that our customers can trust that their metrics are safeguarded.