Operations | Monitoring | ITSM | DevOps | Cloud

April 2023

Whisper Data Migration to the Cloud

In the modern business landscape, the recent surge in cloud computing has become a game-changer, fundamentally altering how organizations manage their IT infrastructure. As businesses increasingly embrace digital transformation, migrating services and applications to the cloud has emerged as a crucial factor in guaranteeing scalability, flexibility, and cost efficiency.

Why Am I Seeing NGINX 502 Bad Gateway: PHP-FPM?

The NGINX Error 502 Bad Gateway is a common error among website users. There are various possible reasons for this error and different ways to solve it. In this article, we will look at the main possible causes and how they can be solved by users and web developers. Use MetricFire's platform to analyze your system’s performance and troubleshoot errors.

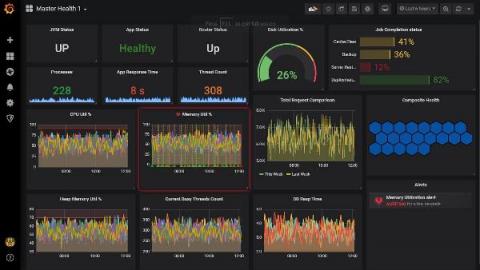
Best Grafana dashboard for IoT Device monitored via MQTT metrics and Graphite

Internet-of-Things (IoT) devices and technologies have penetrated into our life. Nowadays, we can easily find IoT devices around us. Home appliance manufacturers produce IoT products for smart homes. Car makers invest in smart vehicles that can communicate with other smart cars and IoT objects nearby. Governments allocate huge resources to build smart cities with IoT technologies to improve the quality of life for people and promote economic growth.

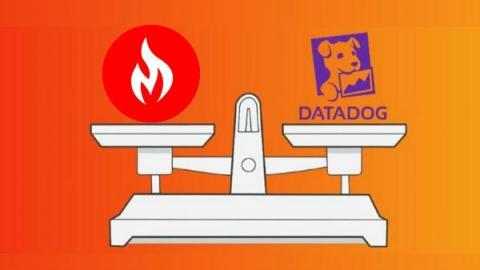
Alternatives to Datadog

Before we dive into the specifics of each alternative to Datadog, let's address the most critical point: scaling. Datadog is great for users who need to do a little bit of everything, but Datadog's biggest weakness is scaling. Datadog can do logs, APM, time series and more, but scaling time-series metrics, alerts, and servers will cause your monthly bill to escalate. The graph below shows what you pay at Datadog vs. MetricFire, a leading competitor.

How to deploy Prometheus on Kubernetes

This is a tutorial for deploying Prometheus on Kubernetes, including the configuration for remote storage on Metricfire. This tutorial uses a minikube cluster with one node, but these instructions should work for any Kubernetes cluster. Here's a video that walks through all the steps, or you can read the blog below. You can get onto our product using our free trial, and easily apply what you learned.

How To Use Our AWS Integration

AWS is a cloud platform that is popular and widely used in many industries. They have many services such as EC2, S3, Lambda, and many more. Since AWS is so popular, being able to easily use it along with your other tools is a priority. We have an AWS integration set up with our tool so that our users have an optimal experience.

Why do you need network monitoring?

Are you tired of dealing with network issues that slow down your business operations and create headaches for your network administrators? Be sure to fix problems you could have prevented before it's too late. Say hello to Network Monitoring! Imagine having a proactive approach to network management, where you can anticipate and prevent network issues from causing costly downtime.

Snowflake Monitoring with MetricFire

In today's world, where data plays a huge role in business success, companies must manage and analyze large amounts of information. Data warehousing has become a critical part of business operations to handle this challenge. Snowflake, a top cloud data warehousing platform, provides a scalable, secure, and flexible solution to help businesses adapt to their ever-changing data needs.

Migrating Graphite to the Cloud

Are you ready to take your monitoring and analysis game to the next level? As businesses increasingly shift to the cloud, migrating Graphite metrics to the cloud has become critical to unlocking the full potential of real-time performance monitoring. In this article, we'll guide you through migrating Graphite to the cloud and show you how to make the transition as smooth as possible. So grab a cup of coffee, and let's dive in!

MetricFire - Dashboards Tutorial

In this video, we explore MetricFire’s powerful dashboarding platform. Discover how to customize your dashboard to view the metrics that matter most to your business. With a variety of visualization options and an intuitive interface, creating and editing charts, tables, and graphs has never been easier. Share your dashboard with your team and keep everyone on the same page. Join MetricFire and start tracking your business metrics today.

Anomaly Detection Using OSquery and Grafana

Detecting unauthorized usage and malicious applications in an instance involves analyzing OS and application logs. Doing this manually is a herculean effort because of the number of logs and the patterns one has to look for. Having a tool that can provide an aggregated view of your instance and the ability to analyze them easily can greatly reduce manual effort.