Troubleshoot Faster with Anomaly Visualization
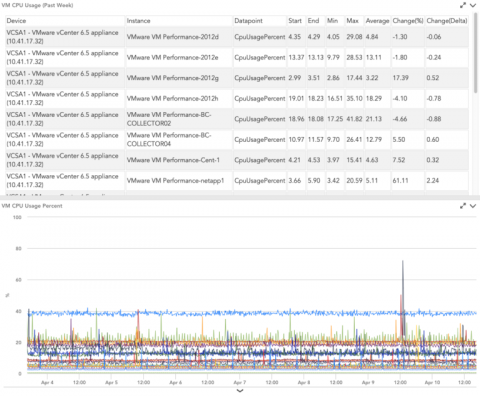
LogicMonitor is proud to announce anomaly visualization as an addition to our growing AIOps capabilities! With this new functionality, users are able to visualize anomalies that occur for a monitored resource and compare that anomaly to key historical signals, such as the past 24hrs, 7 days, or 30 days. Anomaly visualization complements LogicMonitor’s existing forecasting functionality and provides another layer of intelligence to better understand resource health.


