Operations | Monitoring | ITSM | DevOps | Cloud

December 2021

Ask Miss O11y, Holiday Edition

Ooh, good question! My favorite thing about this part of the year is that work slows down, everybody is on vacation, and those of us not traveling get to work on little projects that we’re too busy to touch most of the year. As Martin Thwaites put it: “The Product Owners are away, the devs will play.” For Martin, this year, “play” means adding tracing to more of their services.

Quarterly Product Update: Better Traces, CONCURRENCY, and RATE

At Honeycomb Developer Week, I got an opportunity to walk through a couple of fun new features we’ve shipped since August and ways that we’ve been able to improve Honeycomb for you. Hearing feedback from our users and customers— through support requests, in the Pollinators community, from Twitter, etc.—helps us make Honeycomb better for you.

ICYMI: Honeycomb Developer Week Wrap-Up

Getting started with observability can be time consuming. It takes time to configure your apps and practice to change the way you approach troubleshooting. So it can be hard to prioritize investing time, especially if you can’t clearly see how that investment will pay off. That’s why we put together Honeycomb Developer Week: short, snackable, time-efficient learning sessions to jumpstart your observability journey.

Building Observability in Your CircleCI Deploy

With Liz Fong Jones, Principal Developer Advocate at Honeycomb and Ryan Pedersen, Senior Solutions Engineer at CircleCI In this talk, you’ll learn how Honeycomb keeps its CircleCI workflow duration at about 10 minutes per build through parallelizing build steps, using native container builders per architecture, and tracing execution of the build to know where to optimize.

Graph Observability: Honeycomb and Apollo GraphQL With OpenTelemetry

With David Pickavance, Senior Sales Engineer at Apollo GraphQL Learn how to use Honeycomb, Apollo Studio, and Open Telemetry to optimize GraphQL performance for a federated graph. See how to debug a federated GraphQL query across subgraphs and down to the database layer using Honeycomb.

HoneyByte: Using Application Metrics With Prometheus Clients

Have you ever deep dived into the sea of your tracing data, but wanted additional context around your underlying system? For instance, it may be easy to see when/where certain users are experiencing latency, but what if you needed to know what garbage collection is mucking up the place or which allocated memory is taking a beating? Imagine having a complete visual on how an application is performing when you need it, without having to manually dig through logs and multiple UI screens.

Tracing makes a bug easy to spot

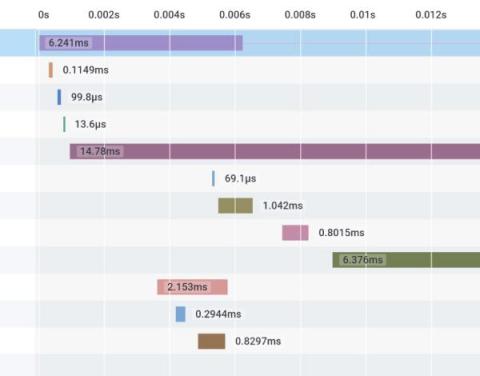
Today, I found a bug before I noticed it. Like, it was subtle, and so I wasn’t quite sure I saw it—maybe I hadn’t hit refresh yet? Later, I looked at the trace of my function and, boom, there was a clear bug. Here’s the function with the bug. It responds to a request to /win by saving a record of the win and returning the total of my winnings so far. Can you spot the problem in the TypeScript? It’s subtle. Now here’s a trace in Honeycomb: Now do you see the bug?