Operations | Monitoring | ITSM | DevOps | Cloud

June 2019

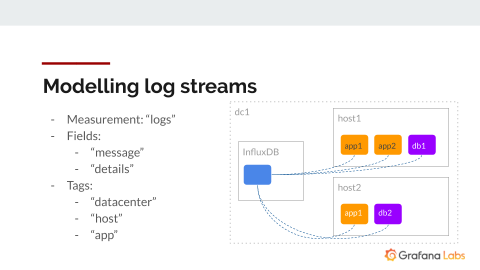
How to Mix Metrics and Logs with Grafana and Influx

It’s time to stop thinking of Grafana as a general dashboarding tool. “Grafana Labs is on a journey to becoming a developer’s observability platform to support your classic DevOps use cases,” said Grafana Labs’ Director of UX, David Kaltschmidt, at a recent talk given at the 2019 InfluxDays Conference in London.

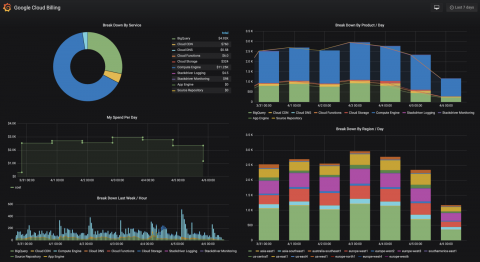
Community Spotlight: BigQuery Plugin

The Grafana community comes up with some pretty cool stuff, and we’re hoping to spotlight some of it from time to time. Today, we’re starting with the BigQuery datasource plugin developed by the team at DoiT International. DoiT is a reseller of Google Cloud and AWS that helps companies either move from on premise to cloud or move from one cloud provider to another.

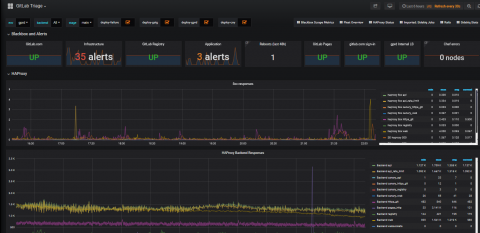
A Look Inside GitLab's Public Dashboards

There are transparent companies – and then there’s GitLab. “GitLab is a ridiculously transparent company,” said Ben Kochie, a Staff Backend Engineer for Monitoring at GitLab. “When GitLab has a database outage, we live stream the recovery on YouTube.” GitLab has the same bare all approach to its metrics. “All of our Prometheus metrics are available on a public Grafana dashboard,” Kochie told the crowd gathered at GrafanaCon.

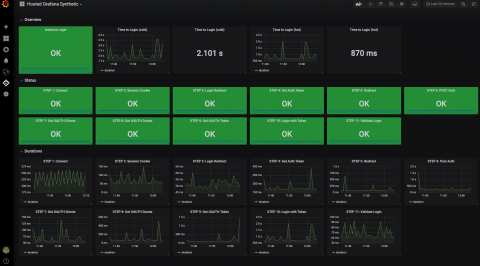
Grafana Tutorial: Simple Synthetic Monitoring for Applications

Often there’s a focus on how a service is running from the perspective of the organization. But what does service health monitoring look like from the perspective of a user? There are many metrics that indicate the overall health of a container, vm, or application, but independently they do not indicate if the system is functioning correctly. Often these metrics (CPU, disk, memory) are too narrow, and they can be poor indicators. High CPU may be desirable or bursts of memory usage may be normal.

How Grafana Labs is Democratizing Metrics Now

Metrics for all – and all for metrics. At Grafana, we not only strive to give people a “single pane of glass” to unify observability metrics. From the very start, our mission has been to advocate for the democratization of metrics, which is the idea that the paradigm needs to shift between who can store data, why they need to store it, and, ultimately, what they’re able to with it. And Grafana users are a great example of how vast and varied the needs are for data access.

An Open Technology Stack for Industrial IoT

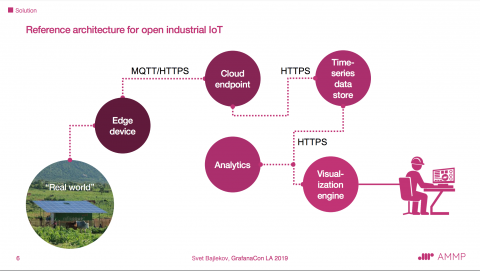
AMMP Technologies runs monitoring for energy systems, usually off mini-grids in Africa. The company uses Grafana to monitor interface with physical objects that are not servers or containers. “It’s interesting how a toolkit for visualizing essentially internet/computer/server metrics is so well-suited to working with real-life streaming data,” AMMP Cofounder Svet Bajlekov said during his talk at GrafanaCon L.A.

How PostgreSQL and Grafana Can Improve Monitoring Together

TimescaleDB is an open source database packaged as a Postgres extension that supports time series, but “it looks as if it were just Postgres,” said Timescale’s Head of Product, Diana Hsieh. “So you can actually use the entire ecosystem. You can use all of the functions that are enabled in Postgres – like JSON indexes, relational tables, post JSON – and they all work with Timescale.”