Operations | Monitoring | ITSM | DevOps | Cloud

September 2019

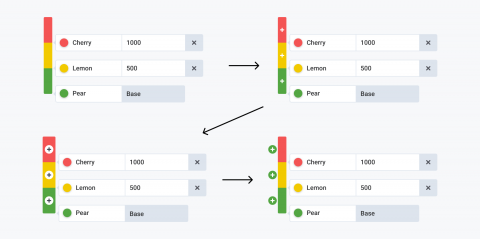
Behind the Grafana UX: Redesigning the Thresholds Editor

As part of building the new Gauge panel in React, we also wanted to update the panel controls, especially the thresholds control. A threshold in the context of Grafana is simply a value that, when exceeded, a condition occurs. An example would be a single stat panel with a green background that changes its background color to red when a threshold is breached.

How Many Metrics? A Guide to Estimating the Size of Your System

Our hosted metrics offering, Grafana Cloud, is billed based on usage; a common question we get is “How much will it cost to monitor N servers?” We charge $49/month for every 3,000 active series or 18,000 data points per minute (dpm), whichever is higher. To help you understand what that translates to in terms of how much storage you need, here’s a rough guide to estimating the size of your system.

How to Fix a Broken Grafana Dashboard with the API

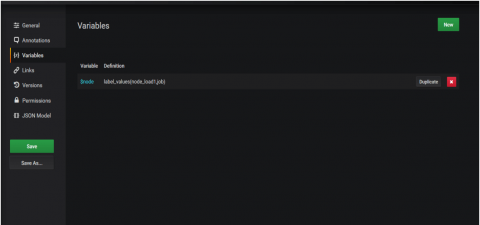
Recently, we ran into a problem where a customer’s dashboard broke to such an extent that it hung on loading. This is a really rare problem and in this case was an instance where the customer had created a variable that referenced itself. Once the dashboard is broken in this way, it is impossible to reach a screen allowing you to remove that variable. This post is not about how it was broken, but about how we resolved the error.

How We've Made It Easy to Migrate Data Using Metrictank Importer Tools

There’s a huge need among our Metrictank and Grafana Cloud customers to be able to import their existing data from Graphite, so we recently refactored the importer tools to make the process easier. A few years ago, I wrote a utility to import Whisper data into Cassandra. At that time, Cassandra was the only store that Metrictank supported. But since then, we’ve added Bigtable, and we’ll likely add more stores.

From Homegrown to Hosted: How The Trade Desk Migrated to a Modern Monitoring System with Grafana Cloud

When Patrick O’Brien interviewed to become a Site Reliability Engineer at The Trade Desk™, it was clear that taking the company’s monitoring system to the next level was the priority. “A chunk of my interview was about The Trade Desk’s previous monitoring system and how to scale it,” says O’Brien, who joined The Trade Desk more than two years ago. “I had a good feeling that would be an early task.”

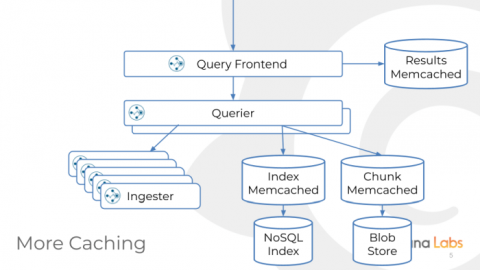
How Grafana Labs Is Running Jaeger at Scale with Prometheus and Envoy

At Grafana Labs, we are always working on optimizing query time on our Grafana Cloud hosted metrics platform, which incorporates our Metrictank Graphite-compatible metrics service, and Cortex, the open source project for multitenant, horizontally scalable Prometheus-as-a-Service.

Streamlined Authentication, More Plugins, and Better Permission Structures with Grafana Enterprise

With the recent release of Grafana 6.3 substantial refactoring and improvements to plugins, external auth systems, and permissions have been introduced in Grafana Enterprise. Let’s take a look at some of the latest Enterprise features here.

How We Differentiate Grafana Enterprise from Open Source Grafana

We are building Grafana Labs to be a sustainable open source company. In addition to maintaining the open source project and community around Grafana, we offer paid products that help make that possible. Grafana Enterprise was introduced over a year ago and adds features needed by enterprise-level organizations. In this blog post we’ll discuss some of those features and how we decide what goes into Grafana Enterprise.

The (Mostly) Complete History of Grafana UX

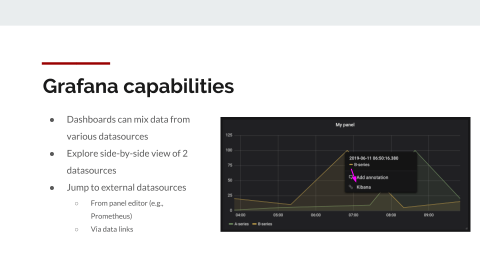
Before Grafana, there was Kibana 3. Kibana was revolutionary when it came out, because it allowed you to use Elasticsearch in a very new way, for log analytics and not just normal document search, and to build dashboards without writing JSON documents. It had this nice UI, which let you drag panels around. But editing panels was a little tricky; you could only edit them in this sort of fullscreen modal. Still, it was really good for its time.