Operations | Monitoring | ITSM | DevOps | Cloud

August 2018

Monitoring and securing Java apps at Quby.

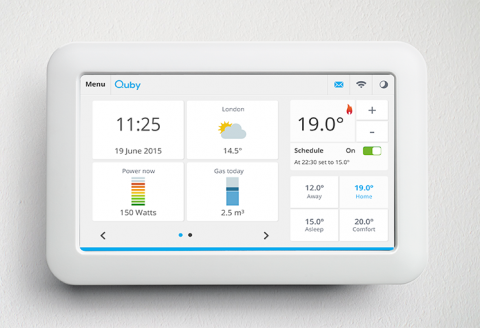
Moving to a Docker-based cloud for Java apps orchestrated by Mesos Marathon required a different approach to monitoring and security for Quby, the Amsterdam-based developer of smart home solutions and maker of smart thermostat and service platform ‘Toon.’ That’s when they found Sysdig. The Sysdig Cloud-Native Intelligence Platform helps Quby resolve issues faster, and reduces monitoring system administration effort by 400%.

Kubernetes Monitoring with Prometheus: AlertManager, Grafana, PushGateway (part 2).

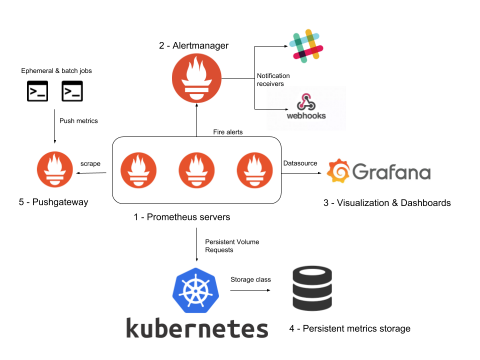
A complete ‘Kubernertes monitoring with Prometheus’ stack is comprised of much more than Prometheus servers that collect metrics by scraping endpoints. To deploy a real Kubernetes and microservices monitoring solution, you need many other supporting components including rules and alerts (AlertManager), a graphics visualization layer (Grafana), long term metrics storage, as well as extra metrics adapters for the software that is not compatible out of the box.

Kubernetes Monitoring with Prometheus -The ultimate guide (part 1).

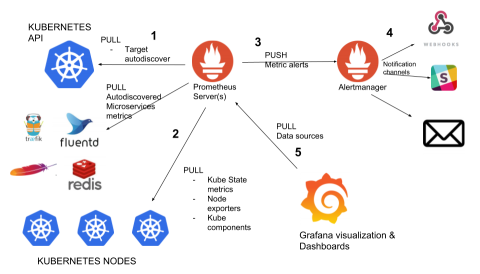
Prometheus monitoring is fast becoming one of the Docker and Kubernetes monitoring tool to use. This guide explains how to implement Kubernetes monitoring with Prometheus. You will learn how to deploy Prometheus server, metrics exporters, setup kube-state-metrics, pull, scrape and collect metrics, configure alerts with Alertmanager and dashboards with Grafana.