Operations | Monitoring | ITSM | DevOps | Cloud

March 2023

Troubleshooting Application Issues with Extended Labels

Troubleshooting issues in Kubernetes can be tough. When diagnosing these problems, you can find yourself with tons of microservices to review. Sometimes you come across the root cause straight away, but when dealing with complex issues you may lose a lot of time going back and forth, and time is a precious asset when everything goes up in flames. Sysdig Agent leverages eBPF for granular telemetry.

Kubernetes CreateContainerConfigError and CreateContainerError

CreateContainerConfigError and CreateContainerError are two of the most prevalent Kubernetes errors found in cloud-native applications. CreateContainerConfigError is an error happening when the configuration specified for a container in a Pod is not correct or is missing a vital part. CreateContainerError is a problem happening at a later stage in the container creation flow. Kubernetes displays this error when it attempts to create the container in the Pod.

Migrating from Prometheus, Grafana, and Alert Manager to Sysdig Monitor

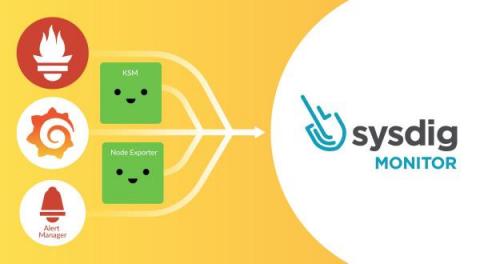
Are you an OSS Prometheus, Grafana, and Alert Manager user thinking about migrating to Sysdig Monitor, and don’t know about the transition details? Are you wondering what the benefits are of using Sysdig Monitor instead of DIY Prometheus, Grafana, and Alert Manager? If so, then this article is for you!

Kubernetes CPU Requests & Limits VS Autoscaling

In a prior blog post, we discussed the basics of Kubernetes Limits and Requests: they serve an important role to manage resources in cloud environments. In another article in the series, we discussed the Out of Memory kills and CPU throttling that can affect your cluster. But, all in all, Limits and Requests are not silver bullets for CPU management and there are cases where other alternatives might be a better option.

AWS recognizes Sysdig as an Amazon Linux 2023 Service Ready Partner

Sysdig is pleased to announce that we’re now recognized as Amazon Linux 2023 Ready as part of the Amazon Web Services (AWS) Service Ready Program. Amazon Linux 2023 (AL2023) is the newest Linux operating system from AWS available to support your workloads running on Amazon EC2. The team at Sysdig validated AL2023 with Sysdig Secure and Sysdig Monitor to ensure full support for our container security and cloud-native monitoring capabilities with this latest OS.

Easily Monitor Google Cloud with Sysdig's Managed Prometheus

Google Cloud provides its own set of metrics for monitoring applications, services, and instances. There are a huge number of metrics – more than 1,500 different ones just for GCP monitoring! While this is great, dealing with such a number can also be overwhelming. Filtering, pulling, exploring, and storing the metrics that you really need can be an enormously time-consuming task, and a big challenge.

Bypassing Network Detection with Graftcp

What is the difference with similar tools? Detect graftcp with Falco Conclusion A new network open source tool called graftcp (GitHub page) has been discovered in everyday attacks by the Sysdig Threat Research Team (TRT). Nowadays, threat actors try to improve their techniques by using new tools (as we mentioned in the PRoot article) to enhance the compatibility of their code to hit as many targets as possible and hide their traces properly.

Monitoring with Custom Metrics

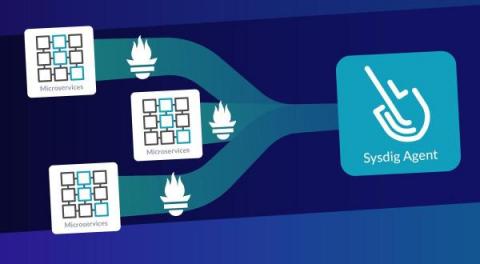
By kickstarting a monitoring project with Prometheus, you might realize that you get an initial set of out-of-the-box metrics with just Node Exporter and Kube State Metrics. But, this will only get you so far since you will just be performing black box monitoring. How can you go to the next level and observe what’s beyond? They are an essential part of the day-to-day monitoring of cloud-native systems, as they provide an additional dimension to the business and app level.