Operations | Monitoring | ITSM | DevOps | Cloud
CI CD
The latest News and Information on Continuous Integration and Development, and related technologies.
Observability versus monitoring in software development
To supervise the behavior of distributed applications and track the origin of service failures and downtime, developers often use traditional monitoring technologies and tools. However, this approach can fall short in its ability to measure the overall health of modern cloud-native architectures, which can span multiple hosting environments and encompass hundreds of microservices.
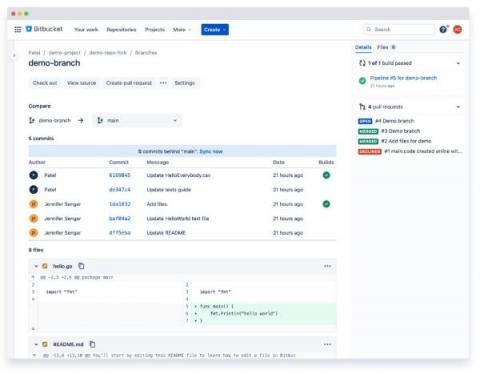
Introducing Bitbucket's redesigned Branch page
Codefresh Software Delivery Platform and the Argo Project
After we launched the Codefresh Software Delivery Platform (CSDP) in February, we had a lot of questions from current users and the community about the relationship between CDSP and the Argo projects.
Continuous integration for Angular applications
Automated testing is the foundation of your continuous integration practice. Automated testing clarifies the status of build processes for your team’s applications, ensures that tests run on every commit or pull request, and guarantees that you can make quick bug fixes before deploying to the production environment. In this tutorial, I will show you how to automate the testing of an Angular application.
How to find and monitor engineering metrics for team success
Welcome to the engineering metrics guide for team success. Engineering metrics are data that teams can use to make informed decisions and operate at maximum efficiency. Don’t use CI on your team? Learn why continuous integration is key to increasing deployment frequency.
How to Use Pub Repositories in Artifactory
Automate the deployment of Angular apps to Firebase
Developers use JavaScript frameworks like Angular, React, and Vue.js to build every kind of single page application, from simple to complex. By separating JavaScript and CSS, frameworks let dev teams structure applications in modular chunks of code that carry out a single function. That is great, but once your application is ready for deployment to production, you will need a command to compile and bundle the separate files into a single one.
Cloudsmith Supports OpenSSF's Efforts to Secure OSS
As part of our mission to make it simple to secure software at scale through Continuous Packaging, Cloudsmith is excited to announce that we have become an Open Source Security Foundation (OpenSSF) member. OpenSSF is a cross-industry forum for a collaborative effort to improve security in open source software (OSS). One software pipeline's output is another's dependency- we are all splashing around in each other's supply chains.
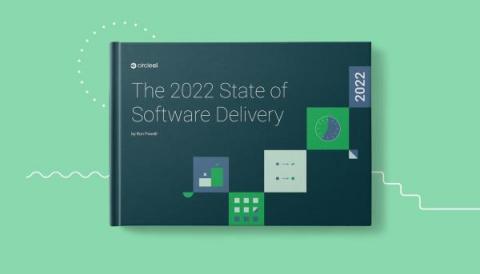
Discover 2022 DevOps trends with CircleCI data report
If you’re like many of our customers, the phrase software supply chain entered your lexicon this year. You’ve begun to feel the complexities and vulnerabilities of that supply chain. You’ve connected the dots between more reliable software delivery and business success. You’re recognizing the gains developer efficiency can have on profitability.


