Operations | Monitoring | ITSM | DevOps | Cloud
Containers
The latest News and Information on Containers, Kubernetes, Docker and related technologies.
8 Surprising Facts About Real Docker Adoption
Containers vs. Serverless from a DevOps standpoint @BudapestJS by Adnan from Dashbird
Monitoring Java applications: Memory usage, threads and other JRE metrics
In this post we will cover how to monitor the Java Runtime Environment (JRE). You will learn how to assess the performance of your Java application by profiling its memory usage, the garbage collector metrics, monitoring Java daemon and user threads and other fundamental JRE metrics. We will finish with a real Java JRE troubleshooting example using opensource Sysdig and Docker.
Sysdig Monitor 3.0 - Enterprise-grade Prometheus, Kubernetes insights and more.
Today we announced the launch of enterprise-grade Prometheus monitoring with Sysdig Monitor 3.0. We’ve added new Prometheus capabilities like PromQL, a Grafana plugin and new enhancements for our already rich Kubernetes monitoring. If you love Prometheus like we do, and especially if your cloud environment is growing quickly, read on to learn more about what we’re doing with Prometheus, Kubernetes and more.
What's new in Kubernetes 1.12?
Here at Sysdig we follow Kubernetes development pretty closely. Next Tuesday the next release of our favourite orchestration tool will get out of the oven freshly baked, so this is a summary of what’s new in Kubernetes 1.12!
StackStorm Enterprise HA in Kubernetes - eta
More groups are progressing from just talking about Event-Driven Automation to actually doing it in practice. StackStorm helps make this easy. When organizations start offloading business-critical tasks and automating for real it becomes essential to ensure that the Automation engine itself is not a single point of failure when it is responsible for recovering a fleet of servers, managing datacenters, and automating remediations.
Kubernetes and containers adoption growing fast
Cloud-native development and microservices enable development teams to work more efficiently and innovate faster. Operators appreciate the container environment because it increases infrastructure utilization, enabling them to accomplish more with less while managing critical applications at unprecedented scale. Kubernetes and containers adoption growing fast in the last few years.
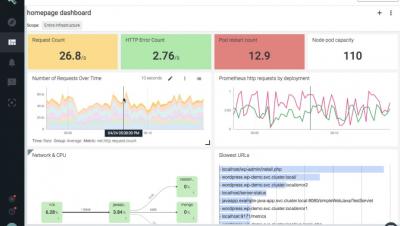
Container Monitoring Overview with Sysdig Monitor
Grafana's Explore UI: Taking a Deeper Dive into Data with Prometheus Queries
When there’s an incident, Grafana is often the starting point for figuring out a response. Users look at a time series panel and form a hypothesis. And in many situations, they’d like to dive deeper. To help make that easier, Grafana Labs has created the Explore UI, which allows you to iterate quickly through Prometheus queries, while leaving your dashboards intact.


