Operations | Monitoring | ITSM | DevOps | Cloud

Latest News

The OpsRamp Monitor: CIO Priorities, Cloud Leaders, Kubernetes Careers

CIOs eat business challenges for breakfast. Everyone wants to know what the CIO is thinking and doing. After all, these brave men and women are leading the charge of marketplace innovation and business productivity. They’re being held increasingly accountable to drive revenues. CIOs are therefore focusing more time on identifying opportunities for competitive differentiation over functional tasks like cost control, according to the 2020 State of the CIO Report, by IDG Research.

Make your monitoring efficient: use clear and visible alerts

Default monitoring settings can be quite usable for most use cases; however, as the monitoring setup grows, certain configuration tweaks might be required to make monitoring more efficient. Alerts should actually attract attention of network administrator; otherwise, they are as good as gone. Alerts sent by monitoring tools should reach their destination. Although it can look obvious, there are several common pitfalls we should warn you about.

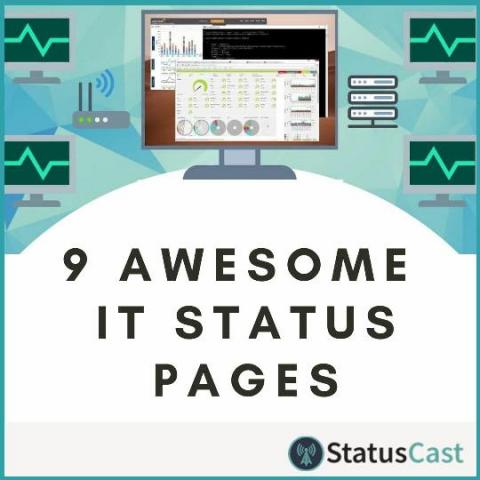
9 Awesome IT Status Pages: Our Top Picks

Status pages have evolved quite a bit over the last few years. Not that long ago you would have been lucky to find a simple up/down indicator, but today organizations are truly embracing transparency. They are providing their end users with critical metrics, incident data, maintenance calendars and even the status of their own service provider technologies.

Streaming Time Series with Jupyter and InfluxDB

Jupyter Notebooks are wonderful because they provide a way to share code, explanations, and visualizations in the same place. Notebooks add narrative to computation. The cells compartmentalize steps and reduce the fear or hesitation associated with editing code. In this way, notebooks act as an invitation for experimentation. Today, I want to extend that invitation and apply it to InfluxDB. In this post, we’ll learn how to query our system stats data from InfluxDB v2.0 using Flux.

Cyclical Statistical Forecasts and Anomalies - Part III

Remember when you wanted great alerts, so you read our past two blogs about cyclical statistical forecasts and anomalies? Hopefully, the techniques in those blogs gave you some great results. Here we’re going to show you another way of finding anomalies in your data using a slightly different technique.

Quantitative Finance with Splunk: 'Who Correlated My Asset'

Over the past 24 months or so, I have been studying investing/trading while also working to become more proficient with Splunk. I like to combine activities and gain momentum, so I decided stock market and economic data would be the perfect way to dig deeper into Splunk and hopefully improve my investing/trading. In the beginning, I only looked at it as a way to learn more about Splunk while using data that was interesting to me.

Speed: A Security Analyst's Best Friend

In so many ways, speed is a security analyst’s best friend. From threat detection to containment to response – the faster you are, the more secure your business will be. It’s exactly why metrics like dwell time, MTTD (mean time to detect) and MTTR (mean time to respond) exist. It’s a barometer for the strength of your organization’s security, and a gauge of success for any good security team.

Bringing Data to Home Security With Arlo

How would you like to be in touch with what’s happening at your doorstep at all times — whether it’s a package delivery, or your loved ones arriving home — no matter where you are? Now think about the folks at Arlo, a leading home automation company, who deliver on this promise for 3.4 million homes in over 100 countries. We hear from Suma about how she uses Arlo to get notified as soon as her kids arrive home from school.

Sentry Integration Platform: Get Insights on the Integrations You Build

Early last year, we launched the Integration Platform to enable any developer to easily create integrations and workflows on top of Sentry. As we continue to build out the platform, we want to give developers visibility into how their integrations are doing. With that, we present the Integration Dashboard!

Docker container monitoring with Netdata

Properly monitoring the health and performance of Docker containers is an essential skill for solo developers and large teams alike. As your infrastructure grows in complexity, it’s important to streamline every facet of the performance of your apps/services. Plus, it’s essential that the tools you use to make those performance decisions work across teams, and allow for complex scaling architectures.