Operations | Monitoring | ITSM | DevOps | Cloud

Latest News

What Is Lambda Architecture? (for dummies)

From ancient Rome and Greece throughout Latin America and Egypt, there is only one thing beside the history itself that kept those ancient times alive even today – the architecture. The most important part of any era in our immersive history was the building of magnificent objects all around the world. These objects, even today, are some of the many wonders of the world.

Will Layer 3 Switches Give Routers the Boot?

Switches are the most common network device deployed on MSP-managed networks, while routers are the least popular—and not by a small margin. The data in Auvik’s recently published report, Managing Network Vendor Diversity: The MSP Challenge, shows switches represent almost half (48%) of all network devices on MSP-managed sites, while routers account for only 6% of the total. Does this mean the death of the router is imminent? In short, no—and here’s why.

Super Monitoring Decorated with 2 Distinctions for Application Performance Monitoring Software

Super Monitoring was recently lauded by a popular software review platform for its steadfast assistance in keeping everyone’s business operations smooth and seamless at all times. For its efficiency in informing users regarding emerging issues and anomalous threats, Super Monitoring was distinguished by the FinancesOnline SaaS review platform with two prestigious awards for 2018: Great User Experience and Rising Star.

Alert fatigue, part 1: avoidance and course correction

Alert fatigue occurs when one is exposed to a large number of frequent alarms (alerts) and consequently becomes desensitized to them. This problem is not specific to technology fields: most jobs that require on-call, such as doctors, experience it in slightly different manners, but the problem is the same.

Sentry + Microsoft Azure DevOps: Error-Tracking, Crash-Reporting, & More

Sentry is updating our key integrations for Azure DevOps (formerly VSTS). With these tightly-woven integrations, developers (like you) can unlock enhanced release tracking, informative deploy emails, and assignee suggestions for new errors. Route alerts to the right person based on the Azure DevOps commit that caused the issue, cutting remediation time to five minutes.

ManageEngine Strengthens Endpoint Security with the Launch of Browser Security Plus at London User Conference

LONDON - Sept. 18, 2018 - ManageEngine, the real-time IT management company, today announced its launch of Browser Security Plus, a browser management solution that helps organisations secure their corporate data in the cloud and protect their networks from web-based cyberattacks. Available immediately, Browser Security Plus provides organisations with a layer of management capabilities for browsers and their add-ons to maintain robust enterprise security.

Connect Insights to Real-Time Action With PagerDuty Visibility

Have you ever gotten that dreaded text from your boss: “The site is down”? Maybe you were meeting with a customer. Or having dinner with your family. Maybe you were presenting at a conference. Doesn’t matter. Whatever else you were doing, now you’re doing emergency incident communication too. You check in with your team leads and confirm there is a problem. You let your boss know the response is under way.

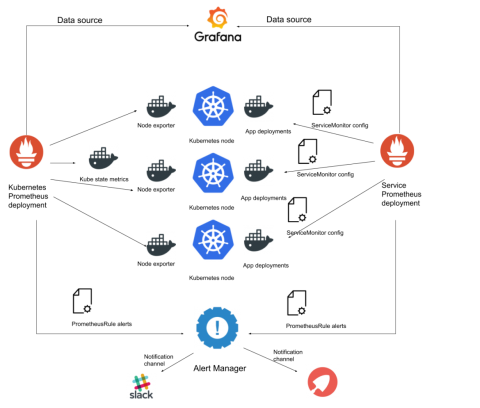
Kubernetes monitoring with Prometheus - Prometheus operator tutorial (part 3).

We covered how to install a complete ‘Kubernetes monitoring with Prometheus’ stack in the previous chapters of this guide. But using the Prometheus Operator framework and its Custom Resource Definitions has significant advantages over manually adding metric targets and service providers, which can become cumbersome for large deployments and doesn’t fully utilize Kubernetes’ orchestrator capabilities.