Operations | Monitoring | ITSM | DevOps | Cloud

Latest Videos

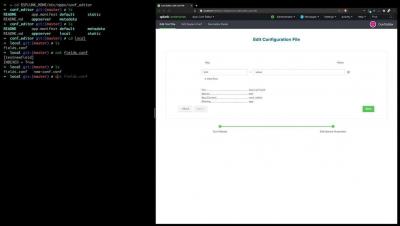
Splunk SOAR Feature Video: Custom Functions

Splunk SOAR’s custom functions allow shareable custom code across playbooks and the introduction of complex data objects into the playbook execution path. These aren’t just out-of the-box playbooks, but out-of-the-box custom blocks that save you time and effort. This allows for centralized code management and version control of custom functions providing the building blocks for scaling your automation, even to those without coding capabilities.

Splunk SOAR Feature Video: Contextual Action Launch

Splunk SOAR apps have a parameter for action inputs and outputs called "contains". These are used to enable contextual actions in the Splunk SOAR user interface. A common example is the contains type "ip". This is a powerful feature that the platform provides, as it allows the user to chain the output of one action as input to another.

Onboarding Data in Splunk Security Analytics for AWS

Splunk Security Analytics for AWS’ new data onboarding wizard quickly takes you from subscribing to the service to visualizing your AWS environment. We’ll walk through the wizard in this video, and you’ll see how the new process can save you hours, days or even weeks when compared to traditional data onboarding processes.

With Splunk Synthetic Monitoring, proactively find and fix your user experience issues

Trend, visualize, and improve performance of all your page resources and third party dependencies. Detect and resolve issues faster across your critical user flows, business transactions and API endpoints using Splunk Synthetic Monitoring.

Prioritize and resolve performance defects with Splunk Web Optimization

Find, fix and prevent web performance issues with an intelligent optimization engine. From Google's Lighthouse scores to core web vitals and 50+ modern performance metrics, learn to benchmark and improve page performance and user-experience with Splunk Web Optimization. Get a free trial as part of Splunk Synthetic Monitoring today.

Detect any issue with Splunk APM before it turns into a customer problem

With 100% of spans and traces captured, Splunk APM meets any necessary business KPI’s and SLO metrics while investigating and troubleshooting transaction errors related to a backend application. Easily construct error budgets that measure performance of services today - learn how with this free trial Splunk Observability Cloud.

Dissecting DevOps - Code-to-Cloud Visibility: The Framework for DevOps Success

Recording from the DevOps.com webinar Code-To-Cloud Visibility where Splunker Chris Riley covers the key concepts to maintain visibility from the point a feature is defined to the point that feature runs in production. Learn about the practices of DevSecOps, Pipeline Analytics, and Observability. And why a Code-To-Cloud strategy is necessary to support and accelerate Cloud and DevOps transformation.

Dissecting DevOps - Measuring quality in a SaaS world: SLA, SLI, SLO

Now that software is delivered over the web and not in a box, how developers guarantee quality to their users has radically changed. Users do not care about version numbers or floppy disks. They just want access to a service that just works. In the microservices world, the quality of your service both to your internal users and external is measured by SLAs, SLIs, and SLOs. And how you decide what those metrics are is a key strategy.